Download
1 / 1
10 likes | 94 Views
?. 1. 1. q 4. =. +. 99%. q 1. q 5. q 6. Mean. q 1. q 4. q 2. q 3. q 2. q 3. Technical Challenges. INCITE R. Baraniuk, E. Knightly, R. Nowak, R. Riedi (Rice), L. Cottrell, J. Navratil (SLAC), W. Feng, M. Gardner (LANL).

E N D
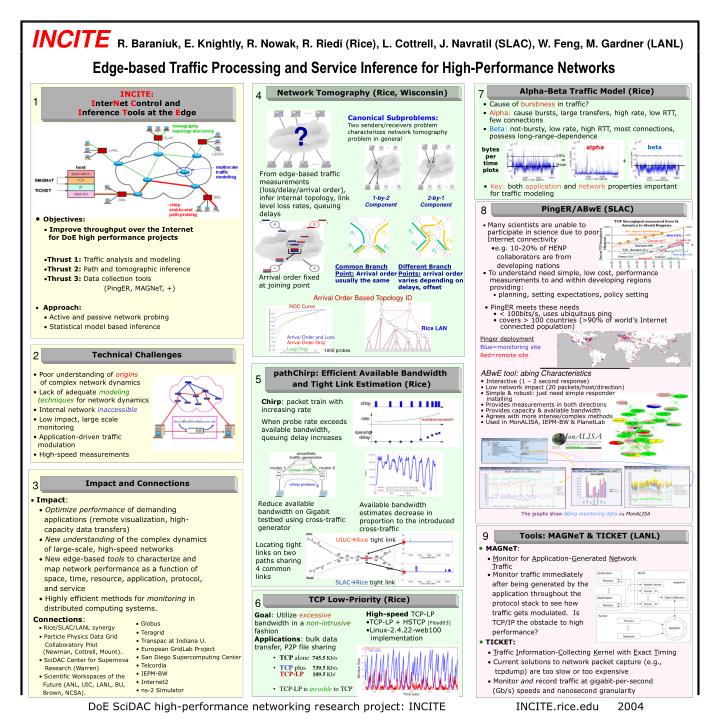
? 1 1 q4 = + 99% q1 q5 q6 Mean q1 q4 q2 q3 q2 q3 Technical Challenges INCITER. Baraniuk, E. Knightly, R. Nowak, R. Riedi (Rice), L. Cottrell, J. Navratil (SLAC), W. Feng, M. Gardner (LANL) Edge-based Traffic Processing and Service Inference for High-Performance Networks 7 4 Alpha-Beta Traffic Model (Rice) Network Tomography (Rice, Wisconsin) INCITE: InterNet Control and Inference Tools at the Edge 1 • Cause of burstiness in traffic? • Alpha: cause bursts, large transfers, high rate, low RTT, few connections • Beta: not-bursty, low rate, high RTT, most connections, possess long-range-dependence Canonical Subproblems: Two senders/receivers problem characterizes network tomography problem in general beta alpha bytes per time plots From edge-based traffic measurements (loss/delay/arrival order), infer internaltopology, link level loss rates, queuing delays • Key: both application and networkproperties important for traffic modeling 1-by-2 Component 2-by-1 Component 8 PingER/ABwE (SLAC) • Objectives: • Improve throughput over the Internet for DoE high performance projects • Thrust 1: Traffic analysis and modeling • Thrust 2: Path and tomographic inference • Thrust 3: Data collection tools (PingER, MAGNeT, +) • Approach: • Active and passive network probing • Statistical model based inference • Many scientists are unable to participate in science due to poor Internet connectivity • e.g. 10-20% of HENP • collaborators are from • developing nations • To understand need simple, low cost, performance • measurements to and within developing regions providing: Common Branch Point: Arrival order usually the same Different Branch Points: arrival order varies depending on delays, offset Arrival order fixed at joining point • planning, setting expectations, policy setting • PingER meets these needs • < 100bits/s, uses ubiquitous ping • covers > 100 countries (>90% of world’s Internet connected population) Arrival Order Based Topology ID ROC Curve Rice LAN Pinger deployment Blue=monitoring site Red=remote site Arrival Order and Loss Arrival Order Only 2 Loss Only 1000 probes • Poor understanding of origins of complex network dynamics • Lack of adequate modeling techniques for network dynamics • Internal network inaccessible • Low impact, large scale monitoring • Application-driven traffic modulation • High-speed measurements • ABwE tool: abing Characteristics • Interactive (1 – 2 second response) • Low network impact (20 packets/host/direction) • Simple & robust: just need simple responder • installing • Provides measurements in both directions • Provides capacity & available bandwidth • Agrees with more intense/complex methods • Used in MonALISA, IEPM-BW & PlanetLab pathChirp: Efficient Available Bandwidth and Tight Link Estimation (Rice) 5 Chirp: packet train with increasing rate When probe rate exceeds available bandwidth, queuing delay increases Bandwidth 3 Impact and Connections • Impact: • Optimize performance of demanding applications (remote visualization, high- capacity data transfers) • New understanding of the complex dynamics of large-scale, high-speed networks • New edge-based tools to characterize and map network performance as a function of space, time, resource, application, protocol, and service • Highly efficient methods for monitoring in distributed computing systems. • Connections: Reduce available bandwidth on Gigabit testbed using cross-traffic generator Available bandwidth estimates decrease in proportion to the introduced cross-traffic The graphs show Abing monitoring dataviaMonALISA 9 Tools: MAGNeT & TICKET (LANL) UIUCRice tight link • MAGNeT: • Monitor for Application-Generated Network Traffic Locating tight links on two paths sharing 4 common links • Monitor traffic immediately after being generated by the application throughout the protocol stack to see how traffic gets modulated. Is TCP/IP the obstacle to high performance? SLACRice tight link 6 TCP Low-Priority (Rice) • High-speed TCP-LP • TCP-LP + HSTCP [Floyd03] • Linux-2.4.22-web100 • implementation Goal: Utilize excessive bandwidth in a non-intrusive fashion Applications: bulk data transfer, P2P file sharing • Globus • Teragrid • Transpac at Indiana U. • European GridLab Project • San Diego Supercomputing Center • Telcordia • IEPM-BW • Internet2 • ns-2 Simulator • Rice/SLAC/LANL synergy • Particle Physics Data Grid • Collaboratory Pilot (Newman, Cottrell, Mount). • SciDAC Center for Supernova • Research (Warren) • Scientific Workspaces of the • Future (ANL, UIC, LANL, BU, • Brown, NCSA). • TICKET: • Traffic Information-Collecting Kernel with Exact Timing • Current solutions to network packet capture (e.g., tcpdump) are too slow or too expensive • Monitor and record traffic at gigabit-per-second (Gb/s) speeds and nanosecond granularity • TCP alone 745.5 Kb/s • TCP plus 739.5 Kb/sTCP-LP109.5 Kb/ • TCP-LP is invisible to TCP DoE SciDAC high-performance networking research project: INCITE INCITE.rice.edu 2004