Download
1 / 10
100 likes | 185 Views
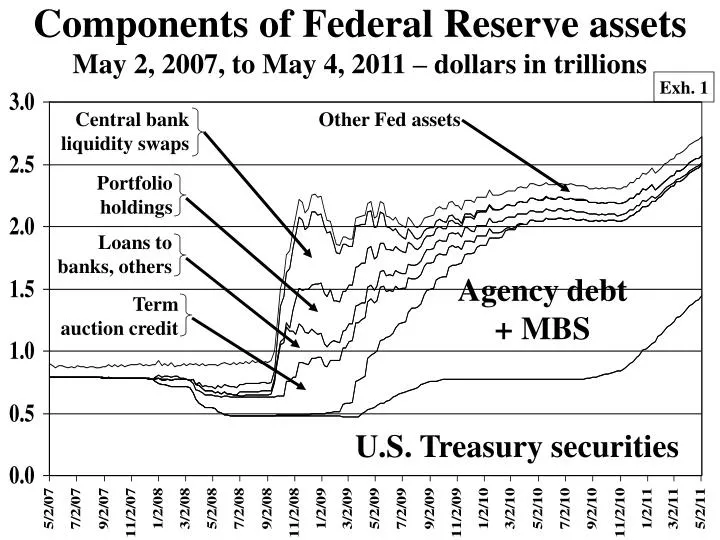
Components of Federal Reserve assets May 2, 2007, to May 4, 2011 – dollars in trillions. Exh. 1. Central bank liquidity swaps. Other Fed assets. Portfolio holdings. Loans to banks, others. Agency debt + MBS. Term auction credit. U.S. Treasury securities.

E N D
Components of Federal Reserve assetsMay 2, 2007, to May 4, 2011 – dollars in trillions Exh. 1 Central bank liquidity swaps Other Fed assets Portfolio holdings Loans to banks, others Agency debt + MBS Term auction credit U.S. Treasury securities
Components of Federal Reserve liabilitiesMay 2, 2007, to May 4, 2011 – dollars in trillions Exh. 2 Other Fed liabilities Capital Treasury deposits at the Fed Reverse repos Bank deposits at the Fed Currency outstanding
Net Treasury Position (NTP)at the FedTreasury securities owned by the Fedminus Treasury deposits at the FedMay 2, 2007, to May 4, 2011 – dollars in trillions Exh. 3 Negative position
The Fed balance sheet grew enormously as it intermediated private-sector credit risk Dollars in billions Exh. 4 6-6-07 6-3-09 5-3-11 1,213 1,133
Taxpayers historically subsidized Fed activitiesThe Fed’s 2007 subsidy equaled $5.7 billion Exh. 5 Treasury Payments to the Treasury – interest on currency – $34.60 billion Interest earned on Fed’s Treasury securities – $40.30 billion Federal Reserve System $44.46 billion Interest on loans – $71 million Interest expense – $1.69 billion Other interest -- $575 million Operating expense -- $4.38 billion Trading gains -- $1.89 billion Benefits plans gain – ($.32 billion) Fee income – $1.51 billion Retained by Fed -- $3.13 billion Other income -- $119 million Dividends to banks – $992 million
The Fed made $52.9 billion in 2010 because of credit, market risks it (taxpayers) assumed Exh. 6 Treasury Payments to the Treasury – interest on currency – $79.27 billion Interest earned on Fed’s Treasury securities – $26.37 billion Federal Reserve System $89.82 billion Interest on loans – $3.53 billion Interest expense – $3.06 billion Other interest – $53.02 billion Operating expense – $5.03 billion Trading gains – $1.34 billion Investments – $4.34 billion Retained by Fed – $.89 billion Fee income – $1.02 billion Dividends to banks – $1.58 billion Other income – $187 million
Changes in the Fed’s income statementfrom 2007 to 2010(Dollars in billions) Exh. 7 Income side Expense side
Fed and Treasury balance sheets(As of March 30, 2011, for the Fed and March 31, 2011, for the Treasury – Not to scale) Exh. 8 U.S. Treasury = Assets/deficit Liabilities On deposit at Fed $118 billion Federal Reserve System Credit supplied to GSEs and private sector $712 billion Liabilities = Assets Currency outstanding (non-interest- bearing Treasuries) $964 billion Treasury debt held by the public and the Fed $9.646 trillion Other – $115 billion Treasuries $1.333 trillion Bank deposits (reserves) $1.458 trillion Accumulated Federal deficit $8.833 trillion GSE debt, MBS $1.070 trillion Treasury deposits $64 billion Credit supplied to private sector $84 billion Repos, other liab. $88 billion Other: $140 billion Capital – $53 billion Other – $132 billion
Consolidated Fed/Treasury balance sheet(As of March 30, 2011 [Fed] and March 31, 2011 [Treasury] – Not to scale) Exh. 9 Assets Liabilities = Bank deposits (reserves) $1.458 trillion GSE debt, MBS $1,212 tiillion Repos, other liabilities $165 billion Student loans – $407 billion Fed capital -- $53 billion Other credit supplied to private sector $247 billion Currency outstanding (non-interest-bear. Treasuries) $964 billion Other assets – $254 billion Interest-bearing Treasury debt held by the public $8.313 trillion Accumulated Federal deficit $8.833 trillion
Consolidated Fed/Treasury balance sheet(As of March 30, 2011 [Fed] and March 31, 2011 [Treasury] – Not to scale) Exh. 10 Assets Liabilities = Bank deposits (reserves) $1.458 trillion GSE debt, MBS $1,212 tiillion $1.676 trillion Repos, other liabilities $165 billion $2,120 trillion Student loans – $407 billion Fed capital -- $53 billion Other credit supplied to private sector $247 billion Currency outstanding (non-interest-bear. Treasuries) $964 billion Other assets – $254 billion Interest-bearing Treasury debt held by the public $8.313 trillion Accumulated Federal deficit $8.833 trillion