Download
1 / 19
190 likes | 416 Views
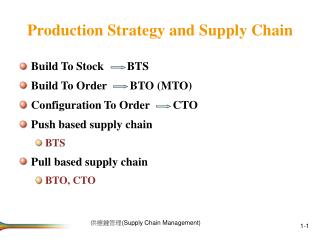
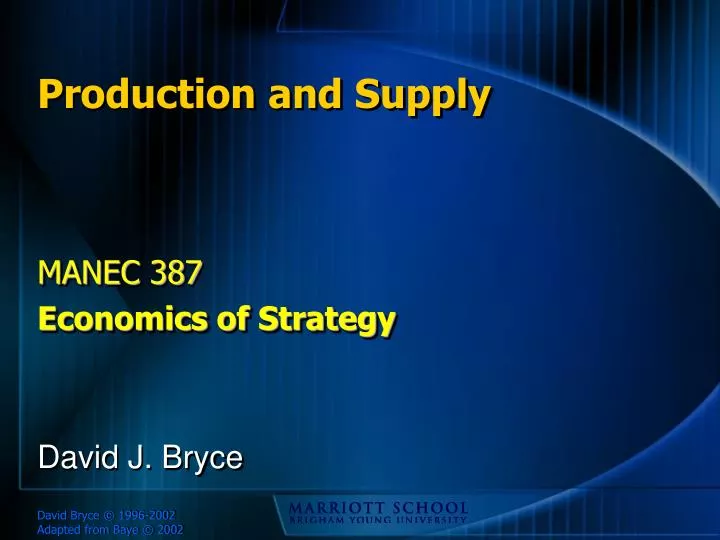
Production and Supply. MANEC 387 Economics of Strategy. David J. Bryce. The Structure of Industries. Threat of new Entrants. Competitive Rivalry. Bargaining Power of Suppliers. Bargaining Power of Customers. Threat of Substitutes.

E N D
Production and Supply MANEC 387 Economics of Strategy David J. Bryce
The Structure of Industries Threat of new Entrants Competitive Rivalry Bargaining Power of Suppliers Bargaining Power of Customers Threat of Substitutes From M. Porter, 1979, “How Competitive Forces Shape Strategy”
Production and Supply • Firms acquire inputs from suppliers • Economics of production determines demand for inputs • Inputs are transformed into outputs through a productivity relationship defined by the “production function” • For example, consider the Cobb-Douglas production function: Q = f(L,K) = ALaKb
Total ProductThe Cobb-Douglas Production Function Q = f(K,L) = K0.5L0.5 • Assume that in the very short run, capital (K) is fixed at 16 units • Short run production function: Q = 160.5 L0.5 = 4 L0.5 • What is total product (output) when we use 100 employees? Q = 4 (1000.5) = 4 (10) = 40 units
Product of Labor • Marginal product of labor – MPL = DQ/DL • Measures the output produced by the last worker • Slope of the production function • Average product of labor – APL = Q/L • Measures the output of an “average” worker
Productivity in Stages Diminishing Marginal Returns Increasing Marginal Returns Negative Marginal Returns Q Q=F(K,L) AP L MP
Use enough input such that marginal benefit equals marginal cost Logic – if one more unit provides more value (PQQ) than it costs (PLL), firm is better off – use another unit Optimal Choice of Input LevelsHow much of an input do I need? TVP PLL Q* PQQ L* Input L Tangency means MVP=MC
Isoquants represent the combinations of inputs that produce a particular level of output Slope of isoquant gives the rate at which we can trade one input for another leaving output unchanged – marginal rate of technical substitution (MRTS) Marginal Rate of Technical Substitution – Cobb-Douglas Input K Q3 Q2 Q1 Input L Q1 < Q2 < Q3
Linear IsoquantsPerfect substitutes – Perfect Complements Leontief (fixed proportion) technology K K Q3 Q2 Q1 Q2 Q3 Q1 L L
Choose optimal inputs such that marginal rate of technical substitution equals the price ratio Logic – if MRTS > price ratio, you can get more production/$ from L than from K. Add more L until its marginal contribution equals that of K Optimal Choice of Input Combinations Input K K* PL/PK L* Input L Tangency means MRTS = price ratio
Input Factor DemandsHow much do we need from suppliers? Input K When the price of labor rises, firm demand for labor falls and demand for capital rises K1 K0 PL/PK L1 L0 Input L
Input Factor Demand K The firm’s demand for an input (from a supplier) is derived from each new equilibrium point found on the isoquant as the price of the input is varied. L $ P0 P1 DL L0 L1 L
Elements of CostFirms Incur Costs Using Inputs $ • Total cost is an (always) increasing function of output and assumes that firms produce efficiently. • Variable cost is the cost of variable inputs (e.g., direct labor, raw materials, sales commissions) and varies directly with output. • Fixed costs remain constant as output increases TC(Q)=VC(Q)+FC VC(Q) FC Q
Properties of Cost $ ATC • The properties of cost are determined by the shape of total cost function • Average cost (AC(Q)) is the average cost per unit (TC(Q)/Q) • Marginal cost (MC(Q)) is the cost of the last unit and defines the rate at which cost changes as quantity changes MC AVC AFC Q
Q0(ATC-AVC) = Q0 AFC = Q0(FC/ Q0) = FC AFC Fixed Cost MC $ ATC AVC ATC Fixed Cost AVC Q0 Q
Q0AVC = Q0 [VC(Q0)/Q0] = Q0(FC/ Q0) = VC(Q0 ) Variable Cost MC $ ATC AVC ATC AVC Variable Cost Q0 Q
Q0ATC = Q0 [TC(Q0)/Q0] = TC(Q0 ) Total Cost MC $ ATC AVC ATC Total Cost AVC Q0 Q
Time and Cost Cost • Once a firm commits to a technology, it cannot immediately change scale – costs are more fixed in the short-run • In the long-run, firms can change technology and scale – costs are more variable • The long-run average cost is the minimum of all short-run cost curves over time. SRAC5 SRAC1 SRAC3 LRAC Quantity
Decision-Making and Cost • Accounting costs inform external constituents. • Economic costs inform internal decision makers and include opportunity costs. • Sunk costs have already been incurred and cannot be avoided. • Economic decisions depend on avoidable costs. • When fixed costs can be redeployed or sold, they are not entirely sunk. • Sunk costs are the basis for strategic commitment.