Download
1 / 25
260 likes | 424 Views
HIGHWAY RANKING MODEL. HIGHWAY RANKING MODEL. – Based on Future Congestion and Its Relief Per Cost – (Congestion Relief is only one of many criteria for selecting projects for construction). Bill Mann, P.E. Transportation Planning Section Northern Virginia District July 25, 2006.

E N D
HIGHWAY RANKING MODEL HIGHWAY RANKING MODEL – Based on Future Congestion and Its Relief Per Cost – (Congestion Relief is only one of many criteria for selecting projects for construction) Bill Mann, P.E. Transportation Planning Section Northern Virginia District July 25, 2006
HIGHWAY RANKING MODEL PURPOSE • No standardized model exists to objectively rank highway improvements. • VDOT has developed a method to do this ranking. • The method piggybacks off MPO traffic forecasting models to rank highway projects. • This tool is just one objective tool in the final ranking process that addresses gridlock.
HIGHWAY RANKING MODEL WHY RANK IMPROVEMENTS? • There is a funding shortfall of $15 billion to meet • the needs of the 2030 Transportation Plan for the • Northern Virginia District. • [TransAction 2030, January, 2006]
HIGHWAY RANKING MODEL • INPUTS (Nothing New is Required) • Area’s Future Highway Networks (Transit networks may be added in later model versions.) • Area’s Future Highway Trips • Improvement Costs • OUTPUTS (Two Ways of Measuring Benefit/Cost Ratios) • Option 1 - Ranking of Improvements by Vehicle Hours of Delay (VHD) Reductions (above LOS _) Per Cost • Option 2 - Ranking of Improvements by Vehicle Miles of Travel (VMT) (above LOS _) Reductions Per Cost • Note: Thresholds for both options are user defined (LOS C, D, E, F, G)
HIGHWAY RANKING MODEL • CODING REQUIRED FOR RANKING • (Took about two weeks for Northern Virginia) • For each network link affected, code: • -- ID Number • -- New Lanes (if needed) • -- New Functional Class Code (if needed) • Provide table of construction costs for each improvement ID • ______________________________________________ • Note: Once all CLRP elements are coded, one could rank selected elements for any forecast year.
HIGHWAY RANKING MODEL MODELING PROCESS (Assumes 70 Improvements as Identified in the CLRP) • Phase I (First Iteration; 70 Individual Assignments) • Calculate VHD for Base Network (with no improvements). • Add Improvement No. 1 to Base and calculate VHD Reductions with this Improvement. • Delete Improvement No. 1 and add Improvement No. 2 to Base; Calculate VHD Reductions with this Improvement. • Repeat Step 3 until all 70 improvements are tested. • Rank all 70 improvements based on their VHD Reductions/Cost.
HIGHWAY RANKING MODEL MODELING PROCESS (Cont’d.) • Phase II (Second Iteration; 69 Individual Assignments) • Add the highest-ranked Improvement from Phase I to the Base Network to get a new Permanent Base. • Calculate VHD for the new Permanent Base. • Repeat Steps 2 through 5. • Remaining 68 Phases • Do 68 Individual Assignments, then 67, 66, etc. • Repeat Steps 6 through 8 until all 70 improvements are ranked. • Summarize results.
HIGHWAY RANKING MODEL MODEL OUTPUTS • Phase I Output shows for each improvement when compared to the • Base the following (tested individually): • -- UserBenefits • 1) Vehicle hours of delay reductions (VHDR) or • 2) VMT at LOS F reductions (VMTR) • -- Construction Costs • -- User Benefit/Cost Ratio expressed as VHDR/C or VMTR/C • ________________________________________________________________________ • Phase II Output shows for each improvement as it is incrementally • added to Base (synergistic effect) what its contribution is relative • to the entire plan: • -- User Benefits (VHDR or VMTR) • -- Construction Costs • -- User Benefit/Cost Ratio
HIGHWAY RANKING MODEL ADVANTAGE OF MODELING IMPROVEMENTS • Improvement A and Improvement B might both be • excellent improvements by themselves based on • gridlock relief per cost. • If A is implemented first, the regional benefits of B • might diminish and may not reduce regional • congestion any further on the regional system until • post-2010/2030. • This process most likely spreads the ranking of • improvements around the region, irrespective of • geography or political boundaries.
HIGHWAY RANKING MODEL WHY HASN’T THIS BEEN DONE BEFORE? • It is cost prohibitive without new software. • One would have to code thousands of computer networks • and run thousands of computer traffic assignments to • rank 70 improvement projects in CLRP (e.g., 70 + 69 + 68 • + 67 + 66 + 65 + etc.) = 2485 runs. • Coding and running 3 networks and 3 traffic assignments • per week in sequential order is all one could do with • traditional modeling techniques. • This approach would take years to accomplish manually.
HIGHWAY RANKING MODEL EXECUTION TIME WITH NEW VDOT MODEL -- 6 days of computer time to rank 70 improvement projects in Northern Virginia CLRP using a PC with Intel 3.06 GHz processor.
HIGHWAY RANKING MODEL THE NEXT SLIDES SHOW REAL SAMPLE RESULTS • VDOT’s Central Office selected 52 Northern • Virginia District arterial candidates for possible • inclusion in the next Six-Year Plan. • These were run through the Highway Ranking • Model using 2005 trips from MWCOG.* • (We could have used 2010 trips.) • *MWCOG=Metropolitan Washington Council of Governments
HIGHWAY RANKING MODEL RANKING RESULTS EXAMPLE: Project 24 reduces 347 vehicle hours of delay (daily) per construction cost ($ millions). Final Output showed that after adding the top 16 improvements, the bottom 36 did little to reduce VHD.
HIGHWAY RANKING MODEL COST EFFECTIVENESS OF IMPROVEMENTS NOTES: 1. This is total cost ($) divided by the vehicle hours of delay saved assuming an interest rate of 5% per year for annualizing capital investments. 2. Delay is measured if LOS D or worse. LOS is user defined.
HIGHWAY RANKING MODEL WHO IS AFFECTED BY IMPROVEMENTS? • COLLECTOR ROADWAYS. Users living in the • immediate area and those using the road and • parallel roads. • FREEWAYS. This can affect users from parallel • roads as far away as 10 miles.
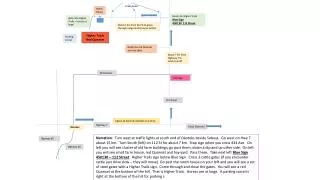
HIGHWAY RANKING MODEL WHERE DOES ALL THE NEW TRAFFIC COME FROM? • In modeling (and in the real world) a roadway • widening could result in a LOS F after the widening • with great benefits to the road and on parallel roads. • Someone may ask: Where did all this “new” traffic • come from? It came from the three “S”s: • -- mode shift, • -- time shift, and • -- diversion shift.
HIGHWAY RANKING MODEL MODEL OUTPUT CORRELATES WITH TTI DATA FOR 2003 NETWORK • Texas Transportation Institute (TTI) estimates 69 hours • of delay per year, per peak period traveler in 2003. • [Source: Washington Post, May 10, 2005] • VDOT/COG model estimates 108 hours of delay per • year, per peak period traveler in Northern Virginia. • ________________________________________________ • Explanation of Differences: • TTI measures delay on Freeways and Major Arterials only. • VDOT measures delays on all roadways, including Minor • Arterials and Collectors.
HIGHWAY RANKING MODEL RECOMMENDED APPROACH FOR IMPROVED TRANSPORTATION PLANNING PROCESS • Rank all plan elements (Comp, CLRP, SYIP) • using future land uses, trips and networks by • forecast year. • For those at bottom half of priority list, investigate • to see why they are low in the ranking. What could • be changed to improve their ranking? • Take results to decision makers for plan updates. • This is an ongoing, continuous, iterative process.
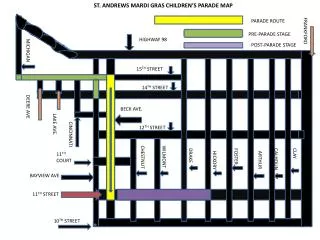
HIGHWAY RANKING MODEL EXAMPLE OF IMPROVED TRANSPORTATION PLANNING PROCESS (Post Processing) ROUTE Z SUBURBS A • Project: Widen Route Z from 4 lanes to 6 lanes; grade separate 3 intersections. • Ranking Model Results: Low • Analysis: Delete interchanges. • Results: Less VHDR, less cost, but benefit/cost ratio improves. • Plan Update: Widen roadway now but postpone building interchanges until after 2020/2030 when LOS drops to F/G based on forecast 2020/2030 land uses. B C ACTIVITY CENTER
HIGHWAY RANKING MODEL OUTPUT OPTIONS • Rank all improvements or only selected improvements. • Rank selected Functional Classification improvements • (Freeways, Major Arterials, and/or Collectors). • Example: Rank only primaries assuming: • -- All planned secondary and freeway improvements • are built, or • -- All planned secondary and freeway improvements • are not built.
HIGHWAY RANKING MODEL OUTPUT OPTIONS (Cont’d.) • Select threshold for LOS delays. • Rank improvements based on: • -- VHD Reductions • -- VHD Reduction/Cost • -- VMT at LOS F Reductions • -- VMT at LOS F Reductions/Cost • Select small or large area or specific jurisdictions • for comparing VHD Reductions.
HIGHWAY RANKING MODEL CONCLUSION With new and better computer models, we can now help decision makers: • Maximize area-wide traveler benefits at minimum • cost • Develop more cost effective transportation plans
HIGHWAY RANKING MODEL Thank You! Questions? Comments ?
HIGHWAY RANKING MODEL CONTACT INFORMATION HIGHWAY RANKING MODEL Bill Mann Bill.Mann@VDOT.Virginia.gov 703-383-2211 Mazen Dawoud Mazen.Dawoud@VDOT.Virginia.gov 703-383-2229