Download

1 / 8
80 likes | 221 Views
Test Statistics for MANOVA. BMTRY 726 2/28/14. Univariate ANOVA. ANOVA valuates differences in mean response among multiple treatment groups Given a random sample We rewrite m l as the overall mean plus the treatment effect of treatment l

E N D
Test Statistics for MANOVA BMTRY 726 2/28/14
Univariate ANOVA ANOVA valuates differences in mean response among multiple treatment groups Given a random sample We rewrite ml as the overall mean plus the treatment effect of treatment l We test our hypothesis using the model Grand mean Treatment effect Error Sample mean Est. treatment effect Residual
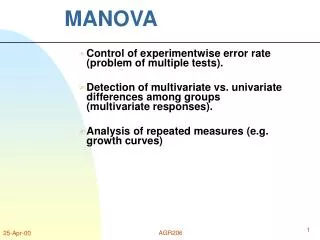
Univariate ANOVA • ANOVA does this by decomposing the variance of the sample into treatment and error components:
F-Test ANOVA • Based on this decomposition, the resulting F test examines the ratio of MStrt to MSe: • We can rewrite this ratio as
Extension to MANOVA • MANOVA is very similar but we are comparing treatment response of a vector of outcomes • We know then that out variance decomposition can be written in vector notation as:
Extension to MANOVA • We can think about adapting our modified F-statistic from ANOVA for the MANOVA case (how would matrices make a difference?) • This then is the matrix analog to the statistic Awe discussed for ANOVA
Extension to MANOVA • However, A is a matrix when we need a single statistic… • Early statisticians came up with several (4 in this case) statistics that all are based on • Wilk’s lambda • Pillai’s trace • Lawely-Hotellingtrace • Roy’s greatest root • All follow an exact or approximate F distribution • All are based on the eigenvalues of A = HE-1
The 4 Statistics • All can be determined using the eigenvalues of A = HE-1 • 3 of the 4 can all be also calculated from H and E