Download
1 / 51
520 likes | 677 Views
Obesity and Spinal Cord Injury: Is it worse than we think?. William A. Bauman, MD Professor of Medicine and Rehabilitation Medicine Mount Sinai School of Medicine, New York, NY Director, Rehabilitation R&D Center of Excellence for the Medical Consequences of Spinal Cord Injury

E N D
Obesity and Spinal Cord Injury:Is it worse than we think? William A. Bauman, MD Professor of Medicine and Rehabilitation Medicine Mount Sinai School of Medicine, New York, NY Director, Rehabilitation R&D Center of Excellence for the Medical Consequences of Spinal Cord Injury James J Peters VA Medical Center, Bronx, NY VA Symposium on Obesity, Nutrition, and Fitness September 27, 2007
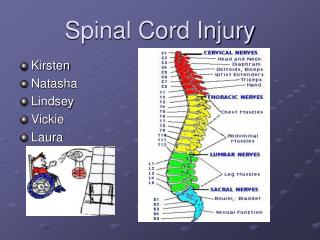
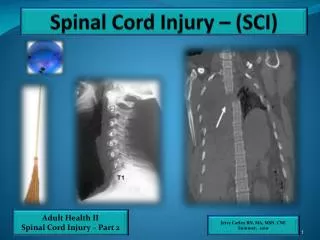
Spinal Cord Injury Neurological Impairment ● Level of Lesion ● Completeness of Lesion Duration of Injury ● Acute ● Chronic
Effect of Spinal Cord Injury: Denervation (Nerve Interruption) Immobilization
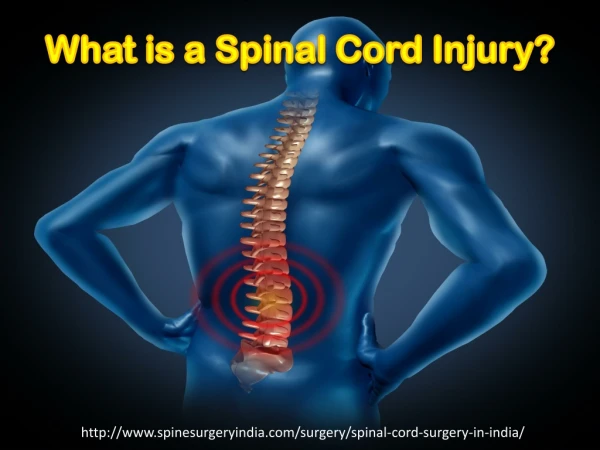
Obesity How do we define it?
Body Mass Index Criteria for Normal, Overweight and Obesity Expert Panel on the Identification , Evaluation and Treatment of Overweight and Obesity in Adults
Using BMI to Define Overweight and Obesity in the Veteran SCI Population Gupta N, et al.Body mass index in spinal cord injury – a retrospective study. Spinal Cord. 44:92-92, 2005 » 408 patients registered in the Zablocki VA Medical Center database ● ~30% of patients had a normal BMI ● 66% were overweight (30% were obese) ● 4% were underweight
“It should be emphasized, however, that the exact degree of adiposity of the SCI patients cannot be determined without the use of more sophisticated measurements of obesity than those used in this study. Evaluations of obesity, based on body weight, undoubtedly under- estimate the actual body fat in this group of patients with denervated mass of muscle.” Bill Duckworth Diabetes.29:906-910, 1980.
“Adjusted” BMI to Define Overweight and Obesity in the Veteran SCI Population Weaver FM, et al. Prevalence of obesity and high blood pressure in veterans with spinal cord injuries and disorders: A retrospective review. Am J Phys Med Rehabil 86:22-29, 2007 » 7,959 veterans with SCI&D ● 33% were overweight by BMI (25-29.9 kg/m2) ○ 37% were overweight by “adjusted” BMI (23-27 kg/m2) ● 20% were obese by BMI (≥30 kg/m2) ○ 31% were obese by “adjusted” BMI (≥28 kg/m2)
40 30 20 10 Skinfold methods 0 DEXA TBW BIA STK DUR SLN J&P Comparison of Methods for Measuring Percent Fat in Persons with SCI Spungen AM et al., Paraplegia. 33:402-408, 1995. Percent Fat
Effect of Acute SCI: Changes in Body Fat 34.0 30.0 26.0 Total Fat (kg) 22.0 18.0 14.0 BL 1 6 12 15 18 24 3 40 36 32 Total Fat (%) 28 24 20 16 BL 12 24 Time after Injury (months)
Concept of the metabolically-obese, but normal-weight man Even if weight remains stable, a typical 75-kg man at age 53 will have 7 kg more fat, and corresponding less lean mass, than he had at age 25. Brozek, J. Fed Proc. 11:784, 1952. From our preliminary data, during the first 2 yearsafter SCI, the average person will gain about 10 kg of fat mass (unpublished).
Cross-Sectional Study: Chronic SCI P<0.0001 40 35 30 * * 25 Total Body Percent Fat 20 Control 15 SCI 10 5 0 < 40 y 40 y * P<0.05 for Control vs. SCI Spungen et al., J Appl Physiol 95:2398-2407, 2003
Body Composition FM SCI FFM
What would my body weight and BMI be if I were not paralyzed?
Body Weight and BMI between Twins Discordant for SCI 81.5 ±13.8 25.4 ±3.4 * * 28 90 71.4 ±6.9 22.3 ±2.3 27 85 26 80 25 75 Weight (kg) Body Mass Index (kg.m2) 24 70 23 65 22 60 21 20 55 NONSCI Twins SCI Twins NONSCI Twins SCI Twins *P<0.05.Results are expressed in mean ± 95% CI
45 40 * 35 30 25 20 Percent Fat Mass 15 10 5 0 Total Body Arms Legs Trunk Average Differences Between Twins SCI NonSCI * p<0.05 Spungen et al., J Appl Physiol 88:1310-1315, 2000
Total Body Lean Tissue Loss with Duration of Injury in the SCI Twins -1 -4 -7 -10 Intrapair Difference for Total Body Lean Tissue (kg) -13 -16 -19 -22 R= 0.87, slope = -0.782 ±0.181, p<0.005 -25 0 5 10 15 20 25 30 Duration of Injury (y) Spungen et al., J Appl Physiol 2000
Body weight = Energy intake – Energy expenditure
Normal Range * P<0.05 Tetra Control Para Control Resting Metabolic Rate (RMR) in Patients with SCI 120 110 100 Percent of Predicted RMR 90 80 70 60 Alexander et al., Arch PM&R, 1995.Liu et al., Adv Skin & Wound Care, 1996.
Is the relationship between fat free mass to resting energy expenditure similar to my non-injured twin?
The Relationship between Energy Expenditure and Lean Tissue in Monozygotic Twins 2600 2400 2200 2000 1800 Resting EE (kcal/day) SCI 1600 NonSCI 1400 SCI (R=0.67, P<0.05) NonSCI (R=0.82, P<0.0005) 1200 1000 25 30 35 40 45 50 55 60 65 70 75 80 Fat Free Mass (kg) Bauman et al, JRRD, 2004.
Energy Expenditure in SCI • Monroe MB, et al. Lower daily energy expenditure as measured by a respiratory chamber in subjects with spinal cord injury compared with control subjects. Am J Clin Nutr. 68:1223-1227, 1998. ○ 10 men with SCI (level C6 to L3) compared with 59 age-matched able-bodied male controls » 24-h EE ↓ in SCI (7,824±305 vs. 9,941±188 kJ/d) -- After adjustment for FFM, FM, & age in SCI: -753 kJ/d » RMR ↓ in SCI » Spontaneous physical activity ↓ in SCI (4.6±0.6 vs. 6.5±0.3%) » Thermic effect of food ↓ in SCI (987±142 vs. 1,544±213 kJ/d) » Sleeping MR was not different in SCI
100 90 Control Lean 80 70 LEG LEAN% SCI Lean *P<0.0001 SCI Fat 60 50 40 30 10 20 30 40 50 60 70 80 70 60 SCI Fat *P<0.0001 SCI Fat 50 40 LEG FAT% 30 Control Fat 20 10 0 10 20 30 40 50 60 70 80 AGE (y) Percent Lean Tissue in Extremities Tetra Para Control 100 90 Control Lean 80 70 ARM LEAN% 60 50 40 30 10 20 30 40 50 60 70 80 70 60 50 40 ARM FAT% 30 Control Fat 20 10 0 10 20 30 40 50 60 70 80 AGE (y) Spungen et al., J Appl Physiol 95:2398-2407, 2003
Testosterone Growth Hormone The Body’s own Anabolic Hormones
Testosterone Growth Hormone The Body’s own Anabolic Hormones
0 5 10 15 20 25 30 35 40 Relationship of Total Testosterone with Duration of SCI 7.0 6.0 5.0 Total Testosterone (ng/ml) R=0.56, p<0.01 4.0 3.0 2.0 1.0 0 Duration of Injury (y) Bauman et al., Horm Met Res 1994
14 12 10 8 Control * 6 SCI * 4 2 0 0 30 60 90 120 Time (min) Growth Hormone Response toIntravenous Arginine GH (ng/ml) IV Arginine Bauman et al., Horm Metab Res 1994
IGF-I Levels by Age Group Normal Range * * P <0.05 Bauman et al., Horm Met Res 1994
Effects of Spinal Cord Injury on the Determinants of Insulin Resistance Muscle mass ↓ Fat mass ↑ Activity ↓
Oral Glucose Tolerance Testing in Veterans with Spinal Cord Injury Duckworth WC, et al. Diabetes. 29:906-910, 1980.
6% 22% 12% 44% 34% 82% Oral Glucose Tolerance in Veterans with or without SCI diabetic diabetic impaired normal impaired normal Spinal Cord Injury Control Bauman et al. Metabolism. 43: 749-756, 1994
Frequency of Impaired Glucose Tolerance and/or Diabetes Mellitus by Neurological Deficit Neurological Subgroup Complete Tetra Incomplete Tetra Complete Para Incomplete Para Percent 73* 44 24 31 *χ2(6)=36.9, p<0.0001 Bauman et al., Spinal Cord, 37:765-771, 1999
Frequency of Hyperinsulinemia Group Tetra Para Percent 53* 37 *P<0.05 Bauman et al., Spinal Cord. 37:765-771, 1999
Insulin Sensitivity versus BMI or %Fat in SCI R2=0.66 SSPG BMI (kg/m2) R2=0.44 SSPG % Body Fat Punj V, et al. Palo Alto VA Health Care System (unpublished)
Relationship between Fasting Plasma Insulin and Insulin Sensitivity in Persons with SCI R2=0.53 SSPG Insulin (μU/ml) Punj V, et al. Palo Alto VA Health Care System (unpublished)
TETRA PARA Percent of Subjects with SCI & Fasting Plasma Insulin 40 35 30 25 Percent of Subjects 20 15 10 5 0 0-5 5-9 10-14 15-19 20-100 Fasting Plasma Insulin Category (µU/ml) Bauman WA, et al. (unpublished)
HDL Cholesterol Adiposity Relationship of Adiposity & HDL Cholesterol in the General Population
Relationships between Insulin Sensitivity with HDL Cholesterol in Persons with SCI P<0.05 HDL Cholesterol (mg/dL) Insulin Sensitivity Bauman et al. Metab. 43:749-756, 1994.
Relationship between Adiposity and the Serum Lipid Profile in Persons with Chronic SCI • 46 men with SCI • Age 49±15y; DOI 17±14y • Lipid correlations with abdominal circumference: • ► HDL (r = -0.421, p<0.01) • ► Triglycerides (r = 0.587, p<0.001) • ► Total to HDL ratio (r = 0.482, p<0.01) • ► LDL to HDL ratio (r = 0.387, p<0.05) Maki KC. Associations between serum lipids and indicators of adiposity in men with spinal cord injury.Paraplegia 33:102-109, 1995.
50 45 40 35 30 HDL Cholesterol by Neurological Deficit Tetra Complete Tetra Incomplete Para Complete Para Incomplete Bauman et al., Spinal Cord. 36:13-17, 1998
121±33 119±34 196±38 124±83 185±38 148±86 38±12 Lipid Profile: SCI and NonSCI Veterans 45 45 40 40 35 35 30 30 25 25 Number of Subjects 20 20 15 15 10 10 5 5 0 0 20 40 60 80 100 120 140 160 180 200 220 80 100 120 140 160 180 200 220 240 260 280 300 TC (mg/dL) LDL (mg/dL) 90 90 80 80 70 70 51±13 SCI 60 60 50 50 Number of Subjects NonSCI 40 40 30 30 20 20 10 10 0 0 0 100 200 300 400 500 600 700 10 20 30 40 50 60 70 80 90 100 110 TG (mg/dL) HDL (mg/dL)
HDL Cholesterol in the SCI Veterans (N=223) HDL cholesterol < 40 mg/dL: 63% HDL cholesterol < 35 mg/dL: 44% HDL cholesterol < 30 mg/dL: 19% Mean HDL cholesterol: 38 ± 12 mg/dL Bauman WA, et al. Topics in Spinal Cord Inj Rehabil. 12:35-53, 2007.
HDL-Cholesterol and CHD Risk (Men in Framingham, MA) 2.0 Average Risk 1.0 Morbidity Risk Ratio (age-adjusted) 0 20 40 60 80 HDL (mg/dL)
Sleep Disturbances Leduc BE, et al.Estimated prevalence of obstructive sleep apnea-hypopnea syndrome after cervical cord injury. Arch Phys Med Rehabil. 88:333-337, 2007. » 41 adults with cervical SCI > 6 months duration ● BMI ≥ 30 kg/m2 (odds ratio = 17.2, P<0.05) Ayas NT, et al.Predictors of loud snoring in persons with spinal cord injury. J Spinal Cord Med. 24: 30-34, 2001 » Evaluated predictors of loud snoring in 197 veterans with SCI ● Snoring is a marker of obstructive sleep apnea. ● BMI >25.3 kg/m2 & antispasticity meds had a 7-fold increased risk of snoring
Mobility Issues Janssen TW, et al.Changes in physical strain and physical capacity in men with spinal cord injuries.Med Sci Sports Exerc. 28:551-559, 1996. » BMI is directly related to the amount of physical strain experienced during activities of daily living (ADLs). Improvement in physical capacity was related to lower BMIs. Van Drongelen S, et al.Upper extremity musculoskeletal pain during and after rehabilitation in wheelchair-using persons with a spinal cord injury.Spinal Cord. 44: 152-159, 2006 » BMI: strong predictor for pain 1 year after in patient rehabilitation. Boninger ML, et al.Shoulder imaging abnormalities in individuals with paraplegia.J Rehabil Res Dev. 38:401-408, 2001 » Positive relationship between imaging abnormalities (radiographic & MRI) and BMI.
Interventions • Diet: • Caloric restriction • Exercise • Upper body • Over ground ambulation • body weight support, parallel bars, leg bracing, etc. • Functional electrical stimulation of extremities • Combined Diet and Exercise • Drug • Surgery
Acknowledgements VA Rehabilitation Research & Development Service National Institute of Disability Rehabilitation Research (NIDRR) James J. Peters Veterans Affairs Medical Center United Spinal Association (formerly EPVA) Spinal Cord Research Foundation Kessler Institute of Rehabilitation Rancho Los Amigos National Rehabilitation Hospital