Download
1 / 17
170 likes | 361 Views
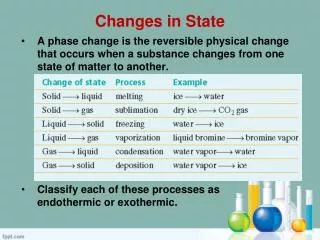
Changes in State. Vapor Pressure observation definition temperature dependence Changes in State enthalpies heating curves Phase Diagrams special points examples. Vapor Pressure. Dfns. pres. of vapor present above a (l) or (s)

E N D
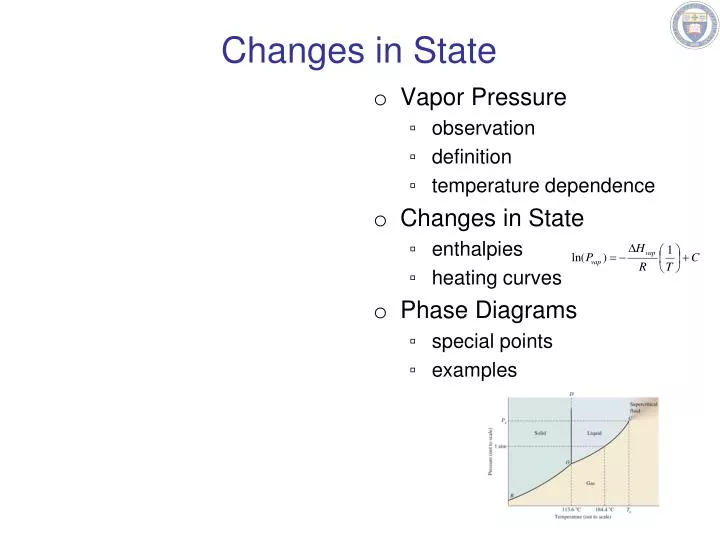
Changes in State • Vapor Pressure • observation • definition • temperature dependence • Changes in State • enthalpies • heating curves • Phase Diagrams • special points • examples
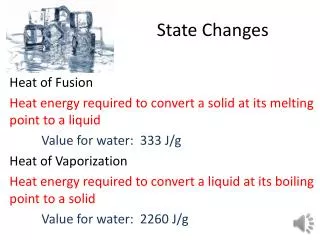
Vapor Pressure • Dfns. • pres. of vapor present above a (l) or (s) • DHvap energy to convert 1 mole liquid to gas at 1 atm • Eq. Vapor Pressure • rate of evaporation = rate of condensation • Measuring Pvapor • Hg column Pvapor = Patm – PHg column
Temperature Dependence R = 8.3145 J/mol•K T = temperature (K) C = const. related to DS
Changes in State: Heating Curve condensation evaporation
Changes in State: Heating Curve condensation evaporation freezing melting
Changes in State: Heating Curve condensation evaporation enthalpy of vaporization freezing melting
Changes in State: Heating Curve condensation evaporation enthalpy of fusion enthalpy of vaporization freezing melting
Phase Diagrams Iodine • Represents the phases of a material at various T and P in a closed system • Experiments • 1: T at P = 1 atm 1 (0.118 atm) (546 C) http://cwx.prenhall.com/petrucci/medialib/ media_portfolio/text_images/FG13_18.JPG
Phase Diagrams Iodine • Represents the phases of a material at various T and P in a closed system • Experiments • 1: T at P = 1 atm • 2: T at P = 0.01 atm 1 (0.118 atm) 2 (546 C) http://cwx.prenhall.com/petrucci/medialib/ media_portfolio/text_images/FG13_18.JPG
Phase Diagrams Iodine • Represents the phases of a material at various T and P in a closed system • Experiments • 1: T at P = 1 atm • 2: T at P = 0.01 atm • 3: T at P = 0.118 atm 1 3 (0.118 atm) 2 (546 C) http://cwx.prenhall.com/petrucci/medialib/ media_portfolio/text_images/FG13_18.JPG
Phase Diagrams Iodine • Represents the phases of a material at various T and P in a closed system • Experiments • 1: T at P = 1 atm • 2: T at P = 0.01 atm • 3: T at P = 0.118 atm • 4: T at P = 1 atm 4 1 3 (0.118 atm) 2 (546 C) http://cwx.prenhall.com/petrucci/medialib/ media_portfolio/text_images/FG13_18.JPG
Phase Diagrams Iodine • Represents the phases of a material at various T and P in a closed system • Experiments • 1: T at P = 1 atm • 2: T at P = 0.01 atm • 3: T at P = 0.118 atm • 4: T at P = 1 atm • 5: P at T = 100. C 4 1 3 (0.118 atm) 2 5 (546 C) http://cwx.prenhall.com/petrucci/medialib/ media_portfolio/text_images/FG13_18.JPG
Phase Diagrams Iodine • Represents the phases of a material at various T and P in a closed system • Experiments • 1: T at P = 1 atm • 2: T at P = 0.01 atm • 3: T at P = 0.118 atm • 4: T at P = 1 atm • 5: P at T = 100. C • 6: P at T = 150. C 4 1 3 (0.118 atm) 2 5 6 (546 C) http://cwx.prenhall.com/petrucci/medialib/ media_portfolio/text_images/FG13_18.JPG