Download
1 / 1
20 likes | 174 Views
Total differentially expressed genes - 292. Down in Ligament – 180 genes. Up in Ligament – 112 genes. Genes with CpG islands – 121. Genes with CpG islands – 70. Enamel. Gingival epithelium. Gingiva. Alveolar bone. Cementum. Periodontal ligament. Root of the tooth.

E N D
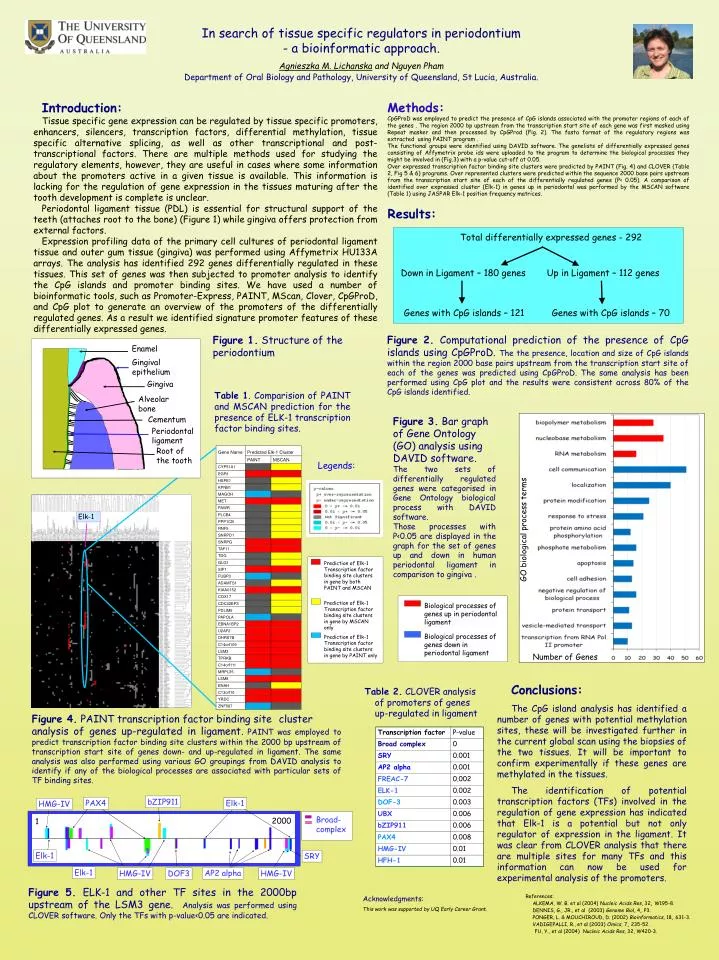
Total differentially expressed genes - 292 Down in Ligament – 180 genes Up in Ligament – 112 genes Genes with CpG islands – 121 Genes with CpG islands – 70 Enamel Gingival epithelium Gingiva Alveolar bone Cementum Periodontal ligament Root of the tooth Prediction of Elk-1 Transcription factor binding site clusters in gene by both PAINT and MSCAN Prediction of Elk-1 Transcription factor binding site clusters in gene by MSCAN only Biological processes of genes up in periodontal ligament Prediction of Elk-1 Transcription factor binding site clusters in gene by PAINT only Biological processes of genes down in periodontal ligament Broad- complex In search of tissue specific regulators in periodontium - a bioinformatic approach. Agnieszka M. Lichanska and Nguyen Pham Department of Oral Biology and Pathology, University of Queensland, St Lucia, Australia. Methods: CpGProD was employed to predict the presence of CpG islands associated with the promoter regions of each of the genes . The region 2000 bp upstream from the transcription start site of each gene was first masked using Repeat masker and then processed by CpGProd (Fig. 2). The fasta format of the regulatory regions was extracted using PAINT program . The functional groups were identified using DAVID software. The genelists of differentially expressed genes consisting of Affymetrix probe ids were uploaded to the program to determine the biological processes they might be involved in (Fig.3) with a p-value cut-off at 0.05. Over expressed transcription factor binding site clusters were predicted by PAINT (Fig. 4) and CLOVER (Table 2, Fig 5 & 6) programs. Over represented clusters were predicted within the sequence 2000 base pairs upstream from the transcription start site of each of the differentially regulated genes (P< 0.05).A comparison of identified over expressed cluster (Elk-1) in genes up in periodontal was performed by the MSCAN software (Table 1) using JASPAR Elk-1 position frequency matrices. Introduction: Tissue specific gene expression can be regulated by tissue specific promoters, enhancers, silencers, transcription factors, differential methylation, tissue specific alternative splicing, as well as other transcriptional and post-transcriptional factors. There are multiple methods used for studying the regulatory elements, however, they are useful in cases where some information about the promoters active in a given tissue is available. This information is lacking for the regulation of gene expression in the tissues maturing after the tooth development is complete is unclear. Periodontal ligament tissue (PDL) is essential for structural support of the teeth (attaches root to the bone) (Figure 1) while gingiva offers protection from external factors. Expression profiling data of the primary cell cultures of periodontal ligament tissue and outer gum tissue (gingiva) was performed using Affymetrix HU133A arrays. The analysis has identified 292 genes differentially regulated in these tissues. This set of genes was then subjected to promoter analysis to identify the CpG islands and promoter binding sites. We have used a number of bioinformatic tools, such as Promoter-Express, PAINT, MScan, Clover, CpGProD, and CpG plot to generate an overview of the promoters of the differentially regulated genes. As a result we identified signature promoter features of these differentially expressed genes. Results: Figure 1. Structure of the periodontium Figure 2. Computational prediction of the presence of CpG islands using CpGProD.The the presence, location and size of CpG islands within the region 2000 base pairs upstream from the transcription start site of each of the genes was predicted using CpGProD. The same analysis has been performed using CpG plot and the results were consistent across 80% of the CpG islands identified. Table 1.Comparision of PAINT and MSCAN prediction for the presence of ELK-1 transcription factor binding sites. Figure 3. Bar graph of Gene Ontology (GO) analysis using DAVID software. The two sets of differentially regulated genes were categorised in Gene Ontology biological process with DAVID software. Those processes with P<0.05 are displayed in the graph for the set of genes up and down in human periodontal ligament in comparison to gingiva . Legends: Elk-1 GO biological process terms Number of Genes Conclusions: The CpG island analysis has identified a number of genes with potential methylation sites, these will be investigated further in the current global scan using the biopsies of the two tissues. It will be important to confirm experimentally if these genes are methylated in the tissues. The identification of potential transcription factors (TFs) involved in the regulation of gene expression has indicated that Elk-1 is a potential but not only regulator of expression in the ligament. It was clear from CLOVER analysis that there are multiple sites for many TFs and this information can now be used for experimental analysis of the promoters. Table 2. CLOVER analysis of promoters of genes up-regulated in ligament Figure 4. PAINT transcription factor binding site cluster analysis of genes up-regulated in ligament. PAINT was employed to predict transcription factor binding site clusters within the 2000 bp upstream of transcription start site of genes down- and up-regulated in ligament. The same analysis was also performed using various GO groupings from DAVID analysis to identify if any of the biological processes are associated with particular sets of TF binding sites. bZIP911 PAX4 Elk-1 HMG-IV 2000 1 Elk-1 SRY Elk-1 AP2 alpha HMG-IV DOF3 HMG-IV Figure 5. ELK-1 and other TF sites in the 2000bp upstream of the LSM3 gene. Analysis was performed using CLOVER software. Only the TFs with p-value<0.05 are indicated. Acknowledgments: This work was supported by UQ Early Career Grant.