Download
1 / 57
570 likes | 935 Views
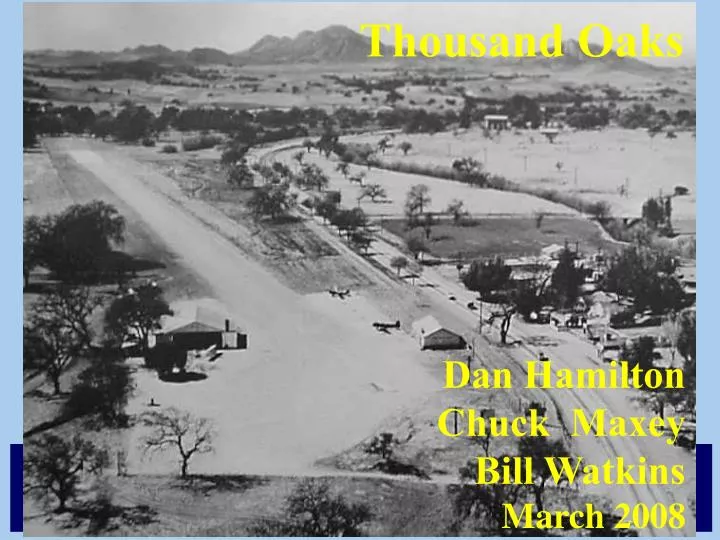
Thousand Oaks Dan Hamilton Chuck Maxey Bill Watkins March 2008 Modeling Endogenous variables Exogenous variables Stochastic relationships Assumptions Embedded in larger model Risks Input-Output models Time Series Modeling Assumptions Compare To Baseline Not What Might Be

E N D
Thousand Oaks Dan Hamilton Chuck Maxey Bill Watkins March 2008
Endogenous variables Exogenous variables Stochastic relationships Assumptions Embedded in larger model Risks Input-Output models Time Series Modeling
Assumptions Compare To Baseline Not What Might Be Not Alternative Scenarios Scenarios
Baseline United States Recession California Recession Land Use Initiative Amgen Scenarios
Real Output Growth Job Growth Population Growth Real Per-Capita General Funds Revenue ScenariosHeadline Data
Baseline Assumptions
United States Economy California Economy Cyclical Slowdown Financial Market Stress Real Estate Related Retail Sales Auto Sales Baseline Scenario
Countrywide Amgen State Budget Local Real Estate Baseline Scenario
United States GDP Growth 7.2 4.5 4.5 4.4 4.2 4.1 4.1 4.0 3.7 3.7 3.6 3.5 3.5 3.4 3.3 3.3 3.2 3.2 3.1 2.9 2.7 2.5 2.5 2.5 2.4 2.3 1.9 1.6 0.8 -0.2 -0.2 -1.9 1980 1983 1986 1989 1992 1995 1998 2001 2004 2007 2010
California GDP Growth 9.9 7.9 7.6 6.2 6.0 5.8 5.8 5.3 4.9 4.6 4.2 4.2 4.0 4.0 3.8 3.8 3.7 3.6 3.5 3.4 3.4 3.0 2.9 2.2 1.9 1.3 1.2 0.6 -0.1 -0.4 -1.0 -1.9 1980 1983 1986 1989 1992 1995 1998 2001 2004 2007 2010
6800 6800 6800 6700 6675 6650 6625 6600 6326 5800 5400 4400 4000 3523 3459 2981 2614 2591 2287 1994 1997 2000 2003 2006 2009 2012 Amgen Employees
Highest Economic Growth Highest Population Growth Slow Growth Weak Home Prices Modest Fiscal Challenges Best Fiscal Outcome Summary
Comparison of United States Scenarios GDP growth rate 7.2 4.5 4.5 4.4 4.2 4.1 4.1 4.0 3.7 3.7 3.6 3.5 3.5 3.4 3.3 3.2 3.1 3.0 2.9 2.7 2.5 2.5 2.5 2.3 2.0 1.9 1.6 0.8 -0.2 -0.2 -1.0 -1.2 Baseline US Recession -1.9 1980 1983 1986 1989 1992 1995 1998 2001 2004 2007 2010
Serious Local Recession Very Weak Home Prices Serious Fiscal Challenges Worst Fiscal Scenario Summary
Comparison of California Scenarios GDP growth rate Baseline CA Recession 9.9 7.9 7.6 6.2 6.0 5.8 5.8 5.3 4.9 4.6 4.2 4.2 4.0 3.8 3.7 3.6 3.5 3.4 3.0 3.0 2.9 2.0 1.9 1.3 1.2 0.6 -0.1 -0.4 -0.5 -1.0 -1.0 -1.5 -1.9 1980 1983 1986 1989 1992 1995 1998 2001 2004 2007 2010
Job Growth Percent change CA Recession Scenario 8.1 6.8 5.8 2.7 2.5 2.1 1.9 0.7 0.7 0.5 0.5 0.2 -0.2 -1.1 -1.1 1998 2001 2004 2007 2010
Intermediate Between Baseline and United States Recession Modest Local Recession Very Weak Home Prices Difficult Fiscal Challenges Summary
Immediate Implementation Development Slows Immediately Time Series Analysis vs. Input-Output Analysis Land Use Initiative
Real Output Growth Percent change Land Use Initiative Scenario 18.0 17.8 8.4 6.4 4.9 4.9 4.7 4.4 4.0 2.1 1.7 1.6 1.3 1.2 0.4 1998 2001 2004 2007 2010
Job Growth Percent change Land Use Initiative Scenario 8.1 6.8 5.8 2.7 2.5 2.1 1.9 0.7 0.7 0.5 0.5 0.4 0.3 0.1 -0.2 1998 2001 2004 2007 2010
Population Growth Percent change Land Use Initiative Scenario 2.7 2.5 2.0 1.7 1.6 1.3 0.8 0.4 0.1 0.1 0.1 0.1 0.0 0.0 1998 2001 2004 2007 2010 -1.1
Real Per Capita General Fund Revenues 2007 dollars Land Use Initiative Scenario 642.5 587.5 568.1 564.4 563.7 561.2 560.6 560.5 557.7 556.7 556.5 555.3 544.2 541.2 539.7 1998 2001 2004 2007 2010
Development Collapses Muted Initial Economic & Fiscal Impacts Very Slow Economic Growth Stronger Home Prices Fiscal & Economic Impacts Increase Over Time Summary
Comparison of Amgen Scenarios Amgen employees 6800 6800 6800 6326 5800 5700 5400 4700 4400 4000 3700 3523 3459 2981 2700 2614 2591 2287 1700 1994 1997 2000 2003 2006 2009 2012 Amgen Baseline Amgen Leaves CA
Local Recession Through Forecast Horizon Extraordinarily Weak Home Prices Fiscal Challenges Increase Over Time Summary