Download
1 / 30
300 likes | 404 Views
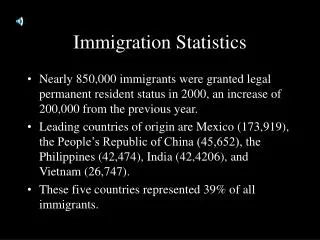
Readily Available Sources for Immigration Statistics. Marc Thomas Northeastern Illinois Planning Commission April 7, 2006. Use the U.S. Census Bureau’s web site to extract data on the foreign born population. Decennial Census

E N D
Readily Available Sources for Immigration Statistics Marc Thomas Northeastern Illinois Planning Commission April 7, 2006 www.nipc.org
Use the U.S. Census Bureau’s web site to extract data on the foreign born population • Decennial Census • Nativity, citizenship, year of entry, region or country of birth, poverty status • American Community Survey • Annual results that will replace the decennial census long-form information • Annual Population Estimates • International migration as a component of population change www.nipc.org
On the U.S. Census Bureau’s home page, click on “American FactFinder” http://www.census.gov www.nipc.org
You can extract tables from two types of data sets:Decennial Census & American Community Survey www.nipc.org
Foreign born data are derived from the decennial census long-form (sample) questionnaire Select quick or detailed tables from the drop down box www.nipc.org
Use the drop down boxes to select geography & then click on ”Next” “You Are Here” keeps you from getting lost & helps you make selection changes more quickly Click to select tables www.nipc.org
Available tables can be located by subject, keyword, or a listing of all tables Describes what’s in the selected table www.nipc.org
Quick tables “QT-P14” & “QT-P15” summarize much of the foreign born data www.nipc.org
From the “Print/Download” drop down box, you can save the tables to your PC in spreadsheet/word processing readable files www.nipc.org
You can extract data for multiple geographies at once Use “You Are Here” to make selection changes more quickly www.nipc.org
You can extract “P” population tables down to block group while “PCT” tables are available down to census tract Searching by “keyword” rather than “show all tables” www.nipc.org
All immigrants living in poverty in Cass Countylived in Beardstown www.nipc.org
Use Census 2000 Summary File 4 to extract foreign born data for specific race & Hispanic groups Population group size must exceed threshold www.nipc.org
After selecting tables to extract, you can pick the race or ethnic group for which you want data www.nipc.org
Nine out of ten Mexicans in Beardstown were foreign born & eight out of ten moved in from 1990-2000 www.nipc.org
Under “Decennial Census” data sets, you can extract 1990 Census results on foreign born to compare to 2000 www.nipc.org
Immigrants were entirely responsible for Beardstown’s gain in population from 1990 to 2000 Source: U.S. Census Bureau www.nipc.org
For data more current than the 2000 Census, turn to the “American Community Survey” data set www.nipc.org
Once again, select your geography & click on “Next” www.nipc.org
Because the sample size is smaller than the Decennial Census, upper & lower bounds & mid-points for the estimates are shown www.nipc.org
From the Census Bureau’s home page, navigate to “Estimates” www.nipc.org
“Components of Population Change” available for the U.S., states, and counties www.nipc.org
After picking your “components of change” table, select your state & file download format www.nipc.org
For the first half of the decade, net immigration was triple the overall population increase in Cass County www.nipc.org
Office of Immigration Statistics – another U.S. agency with data & statistics on immigrants Web address:http://uscis.gov/graphics/shared/statistics/data/index.htm Yearbook of Immigration Statistics • Primarily national data but includes 10-year timeline tables on immigrants admitted & naturalizations by state • PDF file format Profiles on Legal Permanent Residents and Profiles on Naturalized Citizens • Annual data on new immigrants & citizens by state & metropolitan area • Characteristics profiled include age, sex, marital status, & occupation • Lists the top 10 countries of birth • PDF file format www.nipc.org
Turn to the SDC Network for data availability assistance(http://www.census.gov/sdc/www) www.nipc.org
Click on the map or use the drop down box to find SDC agencies in your state www.nipc.org
E-mail Us: Fax Us: mthomas@nipc.org Marc Thomas Northeastern Illinois Planning Commission 312-454-0411 Call Us: Visit Our Website: www.nipc.org NIPC Information Services 312-386-8615 Thank you Contact Us for Assistance or Further Information