Download
1 / 1
10 likes | 24 Views
Measuring the Presence of Clonal Bias in 16s rDNA Clonal Libraries of Environmental Samples. Anirban Ghosh 1 , Max Salganik 2 , Lee Kerkhof 3. Clarkson University, Env. Science and Honors Program 1 , Rutgers University, Institute of Marine and Coastal Sciences 2,3. Results :. Abstract :.

E N D
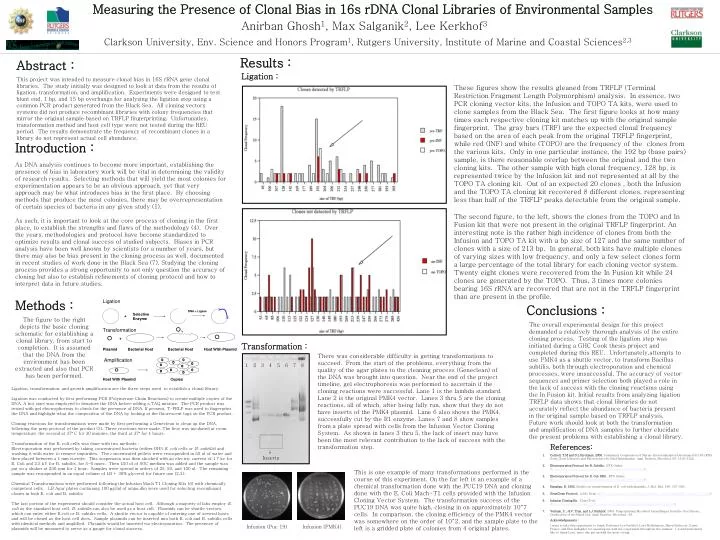
Measuring the Presence of Clonal Bias in 16s rDNA Clonal Libraries of Environmental Samples Anirban Ghosh1, Max Salganik2, Lee Kerkhof3 Clarkson University, Env. Science and Honors Program1, Rutgers University, Institute of Marine and Coastal Sciences2,3 Results : Abstract : Ligation : This project was intended to measure clonal bias in 16S rRNA gene clonal libraries. The study initially was designed to look at data from the results of ligation, transformation, and amplification. Experiments were designed to test blunt end, 1 bp, and 15 bp overhangs for analyzing the ligation step using a common PCR product generated from the Black Sea. All cloning vectors systems did not produce recombinant libraries with colony frequencies that mirror the original sample based on TRFLP fingerprinting. Unfortunatley, transformation method and host cell type were not tested during the REU period. The results demonstrate the frequency of recombinant clones in a library do not represent actual cell abundance. These figures show the results gleaned from TRFLP (Terminal Restriction Fragment Length Polymorphism) analysis. In essence, two PCR cloning vector kits, the Infusion and TOPO TA kits, were used to clone samples from the Black Sea. The first figure looks at how many times each respective cloning kit matches up with the original sample fingerprint. The gray bars (TRF) are the expected clonal frequency based on the area of each peak from the original TRFLP fingerprint, while red (INF) and white (TOPO) are the frequency of the clones from the various kits. Only in one particular instance, the 192 bp (base pairs) sample, is there reasonable overlap between the original and the two cloning kits. The other sample with high clonal frequency, 128 bp, is represented twice by the Infusion kit and not represented at all by the TOPO TA cloning kit. Out of an expected 20 clones , both the Infusion and the TOPO TA cloning kit recovered 8 different clones, representing less than half of the TRFLP peaks detectable from the original sample. Introduction : As DNA analysis continues to become more important, establishing the presence of bias in laboratory work will be vital in determining the validity of research results. Selecting methods that will yield the most colonies for experimentation appears to be an obvious approach, yet that very approach may be what introduces bias in the first place. By choosing methods that produce the most colonies, there may be overrepresentation of certain species of bacteria in any given study (1). As such, it is important to look at the core process of cloning in the first place, to establish the strengths and flaws of the methodology (4). Over the years, methodologies and protocol have become standardized to optimize results and clonal success of studied subjects. Biases in PCR analysis have been well known by scientists for a number of years, but there may also be bias present in the cloning process as well, documented in recent studies of work done in the Black Sea (7). Studying the cloning process provides a strong opportunity to not only question the accuracy of cloning but also to establish refinements of cloning protocol and how to interpret data in future studies. The second figure, to the left, shows the clones from the TOPO and In Fusion kit that were not present in the original TRFLP fingerprint. An interesting note is the rather high incidence of clones from both the Infusion and TOPO TA kit with a bp size of 127 and the same number of clones with a size of 213 bp. In general, both kits have multiple clones of varying sizes with low frequency, and only a few select clones form a large percentage of the total library for each cloning vector system. Twenty eight clones were recovered from the In Fusion kit while 24 clones are generated by the TOPO. Thus, 3 times more colonies bearing 16S rRNA are recovered that are not in the TRFLP fingerprint than are present in the profile. Methods : Ligation Conclusions : DNA + Ligase Selective Enzyme + The figure to the right depicts the basic cloning schematic for establishing a clonal library, from start to completion. It is assumed that the DNA from the environment has been extracted and also that PCR has been performed. The overall experimental design for this project demanded a relatively thorough analysis of the entire cloning process. Testing of the ligation step was initiated during a GHC Cook thesis project and completed during this REU. Unfortunately,attempts to use PMK4 as a shuttle vector, to transform Bacillus subtilis, both through electroporation and chemical processes, were unsuccessful. The accuracy of vector sequences and primer selection both played a role in the lack of success with the cloning reactions using the In Fusion kit. Initial results from analyzing ligation TRFLP data shows that clonal libraries do not accurately reflect the abundance of bacteria present in the original sample based on TRFLP analysis. Future work should look at both the transformation and amplification of DNA samples to further elucidate the present problems with establishing a clonal library. Transformation + Transformation : Plasmid Bacterial Host Bacterial Host Host With Plasmid There was considerable difficulty in getting transformations to succeed. From the start of the problems, everything from the quality of the agar plates to the cleaning process (Geneclean) of the DNA was brought into question. Near the end of the project timeline, gel electrophoresis was performed to ascertain if the cloning reactions were successful. Lane 1 is the lambda standard. Lane 2 is the original PMK4 vector. Lanes 3 thru 5 are the cloning reactions, all of which, after being fully run, show that they do not have inserts of the PMK4 plasmid. Lane 6 also shows the PMK4, successfully cut by the R1 enzyme. Lanes 7 and 8 show samples from a plate spread with cells from the Infusion Vector Cloning System. As shown in lanes 3 thru 5, the lack of insert may have been the most relevant contribution to the lack of success with the transformation step. Amplification 1 2 3 4 5 6 7 8 Host With Plasmid Copies Ligation, transformation, and growth amplification are the three steps used to establish a clonal library. Ligation was conducted by first performing PCR (Polymerase Chain Reactions) to create multiple copies of the DNA. A hot start was employed to denature the DNA before adding a TAQ mixture. The PCR product was tested with gel electrophoresis to check for the presence of DNA. If present, T-FRLP was used to fingerprint the DNA and highlight what the composition of the DNA by looking at the fluorescent tags on the PCR product. Cloning reactions for transformations were made by first performing a Geneclean to clean up the DNA, following the prep protocol of the product (5). Three reactions were made. The first was incubated at room temperature, the second at 37º C for 30 minutes, the third at 37º for 4 hours. Transformation of the E. coli cells was done with two methods : Electroporation was performed by taking concentrated bacteria (either DH5 E. coli cells or B. subtilis) and washing it with water to remove impurities. The concentrated pellets were resuspended in 50 ul of water and then placed between a 1 mm cuvette. This suspension was then shocked with an electric current of 1.7 kv for E. Coli and 2.5 kV for B. subtilis, for 5-6 msec. Then 450 ul of SOC medium was added and the sample was put on a shaker at 250 rpm for 1 hour. Samples were spread in orders of 25, 50, and 100 ul. The remaining sample was resuspended in an equal volume of LB + 30% glycerol for future use (2,3). Chemical Transformations were performed following the Infusion Mach T1 Cloning Kits (6) with chemically competent cells . LB Agar plates containing 100 µg/ml of ampicillin were used for selecting recombinant clones in both E. coli and B. subtilis The last portion of the experiment should consider the actual host cell. Although a majority of labs employ E. coli as the standard host cell, B. subtilis can also be used as a host cell. Plasmids can be shuttle vectors, which can enter either E.coli or B. subtilis cells. A shuttle vector is capable of entering one of several hosts and will be cloned as the host cell does. Sample plasmids can be inserted into both E. coli and B. subtilis cells with identical methods and amplified. Plasmids would be inserted via electroporation. The presence of plasmids will be measured to serve as a gauge for clonal success. References: • Cottrell, T.M and D.L Kirchman. 2000. Community Composition of Marine Bacterioplankton Determined by16S rRNA Gene Clone Libraries and Fluorescence In Situ Hybridization. Appl. Environ. Microbiol. 66: 5116-5122. • Electroporation Protocol for B. Subtilis. BTX Online. <http://www.btxonline.com/applications/protocols/pdfs/PR0009.pdf>. • Electroporation Protocol for E. Coli DH5. BTX Online. <http://www.btxonline.com/applications/protocols/pdfs/PR0013.pdf>. • Hanahan, D. 1983. Studies on transformation of E. coli with plasmids. J. Mol. Biol. 166: 557-580. • GeneClean Protocol. Q Bio Gene. <http://www.qbiogene.com/literature/protocols/dna-kits/pdf/GC.proto-7-03.pdf>. • Infusion Cloning Kit. CloneTech. <http://www.clontech.com/AIT/Ecommerce/Clontech/ProductCatalog.aspx?item=116193>. • Vetriani, C., H.V. Tran, and L.J. Kerkhof. 2003. Fingerprinting Microbial Assemblages from the Oxic/Anoxic Chemocline of the Black Sea. Appl. Environ. Microbiol. 69. Inserts This is one example of many transformations performed in the course of this experiment. On the far left is an example of a chemical transformation done with the PUC19 DNA and cloning done with the E. Coli Mach-T1 cells provided with the Infusion Cloning Vector System. The transformation success of the PUC19 DNA was quite high, closing in on approximately 10^7 cells. In comparison, the cloning efficiency of the PMK4 vector was somewhere on the order of 10^2, and the sample plate to the left is a gridded plate of colonies from 4 original plates. Acknowledgements : I want to take this opportunity to thank Professor Lee Kerkhof, Lora McGuinness, Darryl Babcock, Carrie Fraser, and Erin Gallagher for assisting me with my experiment throughout the summer. I would particularly like to thank Lora, since she put up with the most crying. Infusion (Puc 19) Infusion (PMK4)