Download
1 / 39
390 likes | 804 Views
Bayesian inference, Sampling and Probability Densities. Approximation of real world probabilities Sampling values from complex systems Common statistical distributions Linking back to Bayesian Inference. Mundhenk and Itti , 2008. Probabilities and AI.

E N D
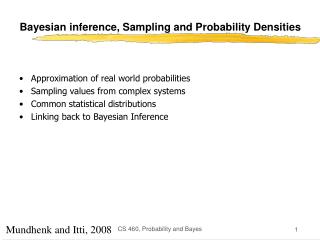
Bayesian inference, Sampling and Probability Densities • Approximation of real world probabilities • Sampling values from complex systems • Common statistical distributions • Linking back to Bayesian Inference CS 460, Probability and Bayes Mundhenk and Itti, 2008
Probabilities and AI • Very often we have incomplete or noisy data • If data is incomplete we might want to be able to infer what is missing • Example: A robot is programmed to pick apples, but all apples do not look alike. Some are greenish and some are red. They have spots etc. However, humans can reliably recognize what an apple looks like without having seen every single apple in the world. • Solution: sample examples of apples (exemplars) and make an inference of what all apples should look like. (easier said than done) • Data can be noisy due to random interference • A robot radio receiver also picks up static but needs to be able to tell the static from a real radio signal. CS 460, Probability and Bayes
We want to use probabilities in Bayesian networks, but how do we know the probabilities? • In closed systems and games probabilities are derived computationally. • For instance, we know, based on a closed set of rules what the likelihood of drawing 21 in blackjack is given your current hand • What about partially observable systems? • How do we derive the likelihood that is should rain tomorrow given that ol’ Granny Clampett’s knee hurts? P(x) = ? CS 460, Probability and Bayes
It may not be viable to know the actual probabilities of events but we can estimate them • It may be too expensive, difficult or time consuming to find the actual probabilities. • What is the actual probability that if you see a duck, it’s white? • We would need to round up every duck in the world and count them??? • It may realistically be impossible to know the actual probabilities • What is the probability that if a cell has chromosome Z then it will become cancerous? • Future work on in biology may be able to model cells well enough to answer this question as if it is a fully observable system, but not today. CS 460, Probability and Bayes
A new solution, with some new problems… • Estimate the probability by taking samples…. • Randomly select 100 ducks and count how many are white • Grow 100 cells of chromosome Z and 100 control cells and compare • New Solution • We only need to take samples or readings to estimate the true probabilities of events and relationships. • This is cheap and anyone can do it. • New Problems • We can introduce (frequently unknowingly) bias we do not want. • We have to deal with error which we frequently cannot find the source of CS 460, Probability and Bayes
What is Bias? • Bias is in general anything which will skew your results such that the probabilities you derive are more erroneous than they should otherwise be. • You decide to only sample ducks at the park only on Sundays, but it turns out that Mallards (which are green-ish) are devout and are at Mass. Thus, your sample is biased away from green. • One of your duck counters is color blind (you can see where this goes) • You make incorrect assumptions in your mathematical computations (we will cover this a little, but it’s an advanced topic) • Etc etcetc CS 460, Probability and Bayes
Real World Bias Example • The news media wants to be able to call elections before all the votes are counted. • To do this, they use exit polls. • As a voter leaves the poll, ask the voter who they voted for. • Well Known Problem: Democrats are more likely to respond to pollsters so exit polls naturally skew towards the democratic candidate. • Possible Solutions: • Change Sampling Method - Pick pollsters who have better luck getting republicans to take polls. Older women for instance have more luck at getting people to take polls. • Change Analysis - Figure out if the bias is predictable by looking at past election errors and compensate mathematically. CS 460, Probability and Bayes
What is error? • Error is in general a measure of a sample measurements tendency to be different than what you expect it to be • In your first sample, 75 out of 100 ducks are white. You might then expect that if you sample 100 more ducks, 75 should be white. If on the other hand, only 60 ducks are white in the second sampling, then you have an error of 15 ducks. • What happened to make the first count different than the second count? How can you account for the 15 duck discrepancy? • If you take a sample of ducks, can you give some estimate of what you should expect the error to be in future samples? • For each sample of ducks, it would be nice for instance to say that with a 95% probability you should count 75 ducks +/- 6 • Error is in general composed of three parts: • Error accounted for • Error not accounted for • Bias CS 460, Probability and Bayes
Error can be estimated • After one takes several measurements, one has a mean value for the measurements. • The mean value is a type of expected value – it’s the value we expect to encounter with future measurements. • The tendency of measures to be different than what one expects them to be is called the error. • Error can be measured or accounted for in many ways depending on what processes one assumes to be causing the error. • There are many standard ways for measuring error, but if you know something about how your data behaves and it does not fit within the paradigm of a typical model, you should think about using something else. • A common way to account for error is with the notion of Variance and the Standard Deviation. CS 460, Probability and Bayes
Using Sampling and Bayesian Inference in AI • Sampling and probability density estimation are widely used throughout the natural sciences. • What about AI? • Machine Learning • Back Propagation Neural Networks. • Computer Vision • Automatic feature learning and detection • Robot Navigation • Simultaneous Localization and Mapping • Internet Tools • Automatic Spam Filtering (Spam Assassin, MailGate) • Operating Systems • Learning user preferences CS 460, Probability and Bayes
How do we make inferences from estimations • As mentioned, we will only estimate the probabilities • To eliminate bias we must sample the world in some sort of rational manner (this can take some thought). • To estimate the probabilities, we need to be able to fit the sampled results with some sort of revealing statistical model (there are many!). CS 460, Probability and Bayes
Example Problem: • We own a local Discothèque for Smurfs, but we don’t want to admit Trolls since they can’t dance very well and often wind up clubbing some guest on the head. We want to train a robot to learn the difference between Trolls and Smurfs and eject any Trolls that try to enter the club. • Trolls and Smurfs can look quite alike, but Trolls tend to be much taller. We will train our robot to measure each guests height and eject guests which are Trolls with greater probability than Smurfs given their height. CS 460, Probability and Bayes
Important things we need to discover • What height do we expect Smurfs or Trolls to be? • How much error is there about our expectation? • How best can we model our expectations? CS 460, Probability and Bayes
First thing, Take some unbiased samples: CS 460, Probability and Bayes
A Little Probability Nomenclature • P(x) – The probability of x. • This is the simple no strings attached probability of x. • p(x) – The probability of x from a function or distribution. • This is the probability of x if we use a function to approximate it (as we will in a minute) • p(x|j) – The probability of x given j. • This is a conditional, what is the probability of x if we have j. For intance, p(rain|clear sky) is distinct from p(rain|cloudy sky). • p(x|j,k) – The probability of x given both j and k. • For instance what is the probability it will rain given that it is cloudy and the barometric pressure is high? • p(rain|cloudysky,high barometric pressure). CS 460, Probability and Bayes
Using Bayes Formula – More Nomenclature • Bayes formula is a synthesis of some basic things we can know about our samples: • How likely are we to see a smurfregardless of its height. This is known as the prior probability writtenP(j) or in this case p(Smurf). • What is the likelihood of observing a height for the population of Smurfs. That is, what is the P of some height conditional on it being a smurf. This is the class conditional probability written p(x|j) or in this case p(height|Smurf). • The marginal probability is the normalizer P(height). This is the number of samples like this. E.g. how many samples are 2” tall. • It should cause p(j|x) to range between 0 and 1. • The solution is the p(Smurf|height). This is what we want which is called the posterior probability. CS 460, Probability and Bayes
How we will use Bayes formula: • What we want is something like: • This tells us that given a height we have measured, what is the probability of the observation being of a Smurf. • We will also compute the same thing for Trolls. If the probability of an observation is higher for one than for the other, then we can make a classification. • If p(Smurf|height) > p(Troll|height) we have a Smurf. • Next… How to compute the odd sounding p(height|Smurf) … CS 460, Probability and Bayes
Compute the Expected Height • Sample Mean is an estimate of m … which is an expectation of the actual value E(x) • In general we can use as an estimate of the expected height m. • Is basically just the average of all the sample measurements • Is BLUE – Best Linear Unbiased Estimator of m • However, keep in mind that if your model is non-linear or has an odd distribution, then m may not be the best estimator! • For Smurfs we estimate m as is 1.925” and for Trolls it is 3.15” • As a note, approaches m as our sample size increases. Thus, m is an expectation given that we can take infinite samples. • As we take more samples, we can account for more error and have greater statistical power! CS 460, Probability and Bayes
What do we expect the error to be like? • Data is frequently distributed about the mean in a normal fashion. • We can see this with a Binomial distribution: • We see that many randomized events in real life tend to distribute around the mean in a bell curve (Gaussian) like manner. • That many things tend to distribute this way is known as the Central Limit Theorem. • Picking a distribution is important. For instance, if we want to predict if its going to rain tomorrow we might use a Gamma distribution rather than a Normal distribution. CS 460, Probability and Bayes
What do we expect the error to be like? • Many but not all sample distributions have a normal distribution about the mean m . • Other distributions include Poisson, Beta, Gamma, Boltzmann, Chi-Square, Cauchy, Dirichletetc. • Exponential so called Generalized Linear Distribution Functions are the most common in use. • It is common and frequently fine to make this assumption. • Look at your samples and make sure that it’s a reasonable assumption Gaussian Probability Density Function (PDF) Gives us a probability estimate What we need to estimate next CS 460, Probability and Bayes Lower case ‘p’ for probability densities
Estimating the error • Sample Variance S is an estimate of s… which is the expected error • By estimating the error we can get our probability distribution and estimate the probability p(x|m,s) • This estimate is commonly known as the Standard Deviation • It is a measure of variance about the mean • Again, as we get more unbiased samples, then S tends to approach s • Thus, we tend to increase the amount of error accounted for and reduce the amount of error not accounted for with larger sample sizes • Note: If we have a strong bias, more samples may not help! CS 460, Probability and Bayes
How to interpret the Gaussian function? • (1) We are computing: • (2) But it doesn’t totally look like what we want: • We interpret the function we computed as: the probability of measuring a height given known properties of Smurf heights. • Thus (1) is a model for (2) where the s andm can be thought of as Smurf population properties we can observe and model. • We might conceptualize (2) as • p(height|Smurf population properties) CS 460, Probability and Bayes
Lets Compute This Puppy! • First we compute the mean (average), what height we expect Smurfs and Trolls to be: • Then we compute the standard deviations and estimate the expected error CS 460, Probability and Bayes
We are now starting to see the picture • For each class we compute a class conditional probability: • We can now get a picture of our probability distribution: p(height|creature) Height CS 460, Probability and Bayes
We can now start to fit into the Bayesian Framework • We compute the prior probability we have observed: • We are starting to see that we have many of the Bayesian parts: • The Prior probability adjusts the outcome to favor the creature more commonly observed • It can be thought of as a weight of sorts • In this case, its just the number of Smurfs or Trolls observed divided by the total observed population • If we count too many Smurfs than is representative of the population, this becomes a bias! We Computed this last frame Now we compute this CS 460, Probability and Bayes
Finishing it up… • We compute the marginal probability which is designed to normalize our probabilities: • Which for Smurfs and Trolls is: • NOW… We can then ask questions like, what is the probability we have some creature given that its height is 2”? CS 460, Probability and Bayes
Now how do we classify? • One simple way is to just break the probability where the probability of a class is the greatest – Decision Boundary • Note: It may break in several places, not just one! Smurfs Trolls Height CS 460, Probability and Bayes
Thus a simple way is…. • If • Then we are observing a Troll • Else • Then we are observing a Smurf • However, how do we guard against our robot ejecting a tall Smurf? CS 460, Probability and Bayes
What happens now? • If we eject a Smurf or Troll based on strict probability, we might create problems… Smurfs Trolls We are ejecting Some % of Smurfs Taller than approx. 2.4” Height CS 460, Probability and Bayes
We falsely identify a Smurf as a Troll!!! CS 460, Probability and Bayes
False Positives and False Negatives • If our robot is set to detect trolls, then we have one false positive match for a troll and two false negative matches for Trolls in this example. • False negative and false positive errors are sometimes referred to respectively as type 1 and type 2 errors • We can estimate the rate of false positives by integrating the area on the other side of the decision boundary. • This is known as the Error Function and is erfc() in C language. • Note: Gaussian Integrals are a tad messy. Smurfs we expect to Be falsely identified As Trolls Trolls we expect to Be falsely identified As Smurfs CS 460, Probability and Bayes
Alternatively we can minimize risk • We my decide that the risk/cost of angering Smurfs we kick out is greater than the risk/cost of letting in a few extra pesky Trolls • Thus, we decrease false positive error at the cost of increasing total error Smurfs we expect to Be falsely identified As Trolls Trolls we expect to Be falsely identified As Smurfs We can do this by either somewhat arbitrarily setting a direct desired probability of false positives that is acceptable or by defining costs and penalties that reduce the loss we expect from false positives CS 460, Probability and Bayes
Minimizing Risk cont’ • We can define a risk as: • Or in our example were we have risk of ejecting too many Smurfs • We would compute L as some loss, perhaps by hand • Overall expected loss would then be: • Which gives us new decision boundaries: CS 460, Probability and Bayes
Adding Classes and Dimensions • We can do all of this for many classes not just two. • All of this still holds if we add a third or forth class of creatures. We can still create decision boundaries. • We can also add additional features to track off of. For instance, we could add nose size etc. • By adding additional features, we can also measure how they interact. CS 460, Probability and Bayes
Notes on Validation • After training your solution needs to be validated. • This helps to ensure that your solution will generalize in the real world • To do this, you need to have a validation set of samples • A common simple solution is to break all your samples into two groups (sometimes three) • Training set which you use to teach the system with • Testing set which you use to check that the your solution is general and that the computer didn’t just memorize a specific solution • Validation Set which is sometimes just your testing set. This is used as a final third set if needed for statistical rigor. • In some types of training you can use other methods such as leave one out validation. CS 460, Probability and Bayes
Examples of other probability distributions • Gamma Probability Distribution – Given that an event has been observed, what is the expected waiting time until it is observed again. • Predict weather, market activity, call center loads etc. • Dirichlet Probability Distribution – What is the probability for several mutually exclusive observations. • Give the expected length of the cuts from equal sized bits of strings. • The distribution is bounded by a simplex. CS 460, Probability and Bayes
Joint Probabilities • Different probabilities can be chained together to create a stronger predictor. • Some probabilities are dependant, that is the probability of an observation or event is effected by the probability of another event. • The probability of a burglar alarm is partially dependant on a burglar entering a building, but other things can set it off. • The P of the alarm sounding is derived from the P of other events such as the P of a burglar and the P that the burglar will set off the alarm. • Dependence can be referred to in many ways depending on its nature: • Covariance, correlation, joint events • Many probabilities are independent, one observation is treated as unrelated to another. • The probability that George Bush dances the Charleston is independent of the probability that I will sneeze. • It is frequently convenient to treat observations as independent if their dependence is very weak in order to make computation easier. CS 460, Probability and Bayes
Joint Probabilities • Probabilities can be dependant on themselves. • The probability of an observation is dependant on having observed it before. • The probability that I will observe a cough is dependant on whether I just observed a cough earlier. For instance, if I have a cold I will observe many more coughs than otherwise. • This is known as a conjugate prior – the posterior probability in one step is the prior probability in another step. CS 460, Probability and Bayes
Further References • Christopher M. Bishop (1995) Neural Networks for Pattern Recognition, Oxford University Press • William L. Hays (1991) Statistics (5th Ed), Harcourt Brace College Publishers • Wikipedia, Probability Distribution, http://en.wikipedia.org/wiki/Probability_distribution • Mathworld, Normal Distribution, http://mathworld.wolfram.com/NormalDistribution.html CS 460, Probability and Bayes