Download
1 / 18
180 likes | 512 Views
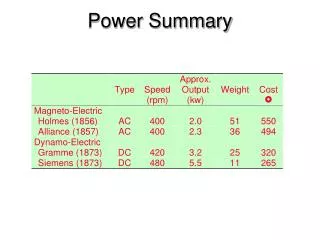
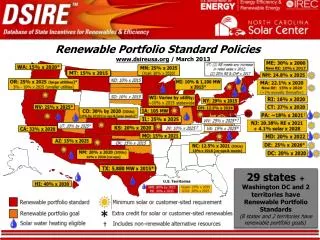
Tucson Electric Power Environmental Portfolio Standard Program Summary. TEP EPS Historic Performance:. TEP EPS Historic Solar Production by Source Type:. 2003 Annual Solar Energy Production: Type: Installed Capacity Annual Energy Energy %

E N D
Tucson Electric Power Environmental Portfolio StandardProgram Summary
TEP EPS Historic Solar Production by Source Type: 2003 Annual Solar Energy Production: Type: Installed Capacity Annual Energy Energy % SunShare Systems 127 kWDCp 128 MWh 2.25% TEP Solar Partnering 43 kWDCp 70 MWh 1.23% TEP Customer Sited 34 kWDCp 57 MWh 1.00% TEP Utility Scale 4,102 kWDCp 5,440 MWh 95.52% Total Solar Generation 4,306 kWDCp 5,695 MWh 100.00%
TEP EPS Financing Attributes: • Utility Scale PV Financial Opportunities • Up Front Financing matches schedule of incremental building blocks. • Minimum funding level of at least $5 M per year to achieve minimum cost scenarios. • No finance charges for high capital cost, rapidly declining cost electricity generation technology taking advantage of minimum module size available with PV. • Leverage of 10% of initial cost through Investment Tax Credits • Possible additional 18% leverage through Production Tax Credits • Double declining balance accelerated depreciation leverage • No loss of revenue from customer self generation; instead • Energy revenue from sale of solar energy is leveraged through investing in future PV at lower per unit cost as PV prices decline over time. • All energy consumers benefit in the long term.
EPS Future Directions: • 2005: • Customer Solar expands to 600 kWDC, SGSSS expands to 5.4 MWDC. • Continue wind survey data monitoring and analysis for all future years. • 2006: • Customer Solar expands to 800 kWDC, no expansion at SGSSS. • Expand landfill capacity to 15 MW. • 2007: • Customer Solar expands to 1,200 kWDC, SGSSS expands to 6,400 kWDC. • 2008: • Customer Solar expands to 1,600 kWDC, SGSSS expands to 7,500 kWDC. • 2009: • Customer Solar expands to 2,000 kWDC, SGSSS expands to 8,600 kWDC – final size. • 2010: • Customer Solar expands to 2,500 kWDC. • Initial 5 MW wind development startup • 2011: • Customer Solar expands to 3,600 kWDC. • Second phase 5 MW wind development startup • 2012: • Customer Solar expands to 5,000 kWDC. • Final phase 5 MW wind development startup
Solar Future Improvements: • Reduce Module costs • Thin Film Technology Development and Reliability Improvements. • Better efficiencies of c-si cells through new treatment and coating processes. • Increased annual PV module production through investment in automation. • Development of low cost PV grade silicon stock. • Development of lower cost alternate packaging materials. • Experience. • Reduce Balance of System Costs • Continue inverter cost reductions to or below $0.20 per Watt AC. • Integrated module, support and electrical design. • Development of USSPV size PV modules (750 W DC) – can reduce BOS costs by 33%. • Reduce Transaction Costs • Larger PV system size. • Sited with other utility assets to share cost of common functions. • Coupled with optimally sized energy storage (SMES or CAES). • Reduced industry overhead as experience is gained with the technology. • Improve system performance, reliability and longevity. • Reductions in all three cost factors must be achieved in a sustainable manner through balanced market growth.
TEP Solar Accomplishments: • Implementation of a Successful Customer Focused PV Support Program • Inverter Interaction with the Electric Grid as it Affects Reliability • IEEE-929 qualification conservative trip points • Grid event experience • RMR generation voltage support • NREL, Sandia and IEEE coordination • PV System Cost Reductions & Performance Improvements • Intermittent Renewable Resource Forecasting • Evaluation of Capacity Value of Intermittent Renewables • Developing a Library of Standardized PV System Data • Large Fixed Plane and with APS, Large Tracking Array PV Annual Energy Production Performance. • Evaluation of the annual energy production performance of a multitude of PV Module Technologies. • Evaluation of the performance of a wide Variety of Different Inverter Topologies and Manufacturers. • Initial and Operating Cost Data for a wide range of PV systems. • Identification and Resolution of Arizona Specific PV System Issues