Download
1 / 12
120 likes | 289 Views
Attribution of Haze Report Status. Fire Emissions Joint Forum Meeting December 8, 2004 Tom Moore Marc Pitchford. Projects Phase I (ARS) Reports AoH Gateway Report (Draft) State Reports Tribal Reports Individual Class I Reports EI Summary Products Mass and Visibility Maps Links

E N D
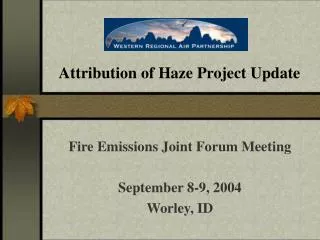
Attribution of Haze Report Status Fire Emissions Joint Forum Meeting December 8, 2004 Tom Moore Marc Pitchford
Projects • Phase I (ARS) • Reports • AoH Gateway Report (Draft) • State Reports • Tribal Reports • Individual Class I Reports • EI Summary Products • Mass and Visibility Maps • Links • Causes of Haze Project • Regional Modeling Center • AoH Emissions Inventories • WRAP EDMS • VIEWS visibility web site • IMPROVE web site • WinHaze Visual Air Quality Modeler • APACE web site Attribution of Haze Work Group: Phase I (ARS) The overall objective of the Attribution of Haze project is to prepare a policy-level report describing the emission source categories and geographic source regions presently contributing to visibility impairment, at each of the over 100 federal and tribal Class I areas in the WRAP region. Air Resource Specialists, Inc. (ARS), was contracted to prepare this report for Phase I of the project, expected to be completed in January 2005. The Phase I report will provide state and tribal air regulators with an initial detailed assessment of the geographic regions and source categories affecting the Class I areas for which they are responsible and will be an integral part of the interactive process the WRAP will pursue toward providing regulators with the information and tools they need to meet the 2007 regional haze plan deadline. For more information regarding the Phase I AoH report, please contact Joe Adlhoch at ARS. ARS AoH Proposal (6/8/2004) PDF ARS Presentation, Denver Meeting (7/23/2004) PPT ARS Presentation, Call 1 (8/10/2004) PPT ARS Presentation, Call 2 (8/24/2004) PPT ARS Presentation, Call 3 (9/7/2004) PPT Revised Agenda for AoH Workgroup Meeting (9/21-9/22/2004) PDF WRAP AoH Meeting, part 1a PPT, part 1b PDF, part 2 PPT, part 3 PPT (9/21-9/22/2004) WRAP AoH Conference Call (10/8/2004) PPT DRAFT Agenda for Las Vegas MeetingDOC WRAP AoH Conference Call (10/22/2004) PDF WRAP Meeting (Las Vegas) (11/16/2004) PDF WRAP Meeting (Las Vegas), part 1PDF, part 2PDF (11/18/2004)
AoH Report - schedule • December 14th – roll out draft report at SSJF/IWG meeting • December 15th through January 20th – • Draft report out for review and comment • Comments to be collected/summarized/addressed by ARS and AoH Workgroup • http://www.wrapair.org/forums/aoh/ars1/index.html • End of January 2005 – Final Report
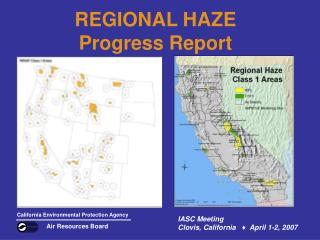
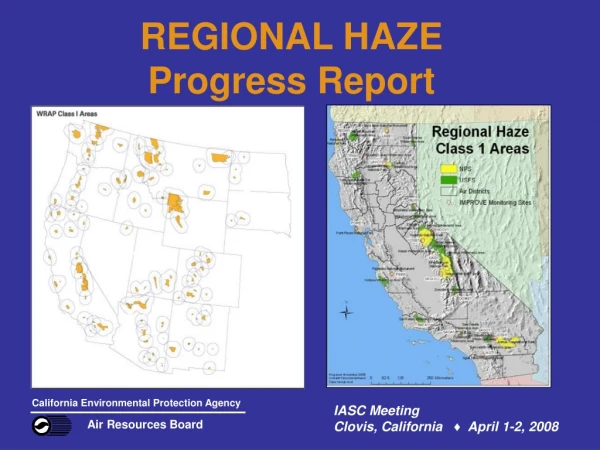
Colorado Attribution of Haze Project Example State Report Page
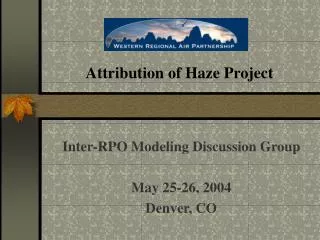
Rocky Mountain National Park Individual Class I Area Report Attribution of Haze Project Rocky Mountain National Park is located abreast the Continental Divide in north central Colorado. Terrain is mountainous and varied, with elevations ranging from near 2,500 m (8,000 ft) at valley bottoms to a high of 4,347 m (14,259 ft) at Long's Peak. Due to its location on the Divide, the western slope is directly impacted by prevailing westerly winds and receives more precipitation than the eastern slope which is in the rain shadow of the Rockies. The town of Estes Park averages 13.1 inches of precipitation; the town of Grand Lake 19.95 inches per year. The National Park includes the headwaters of the westward flowing Colorado River and eastward flowing Cache la Poudre and Thompson Rivers. An IMPROVE monitoring site, ROMO1, is just east of the Park boundary, at an elevation near 2,750 m (9,020 ft). Example Class I area Report Page
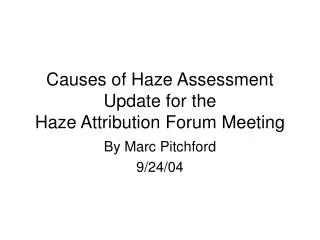
Valid 2002 Reconstructed Light Extinction Monitoring Data – Crater Lake NP
Valid 2002 Reconstructed Light Extinction Monitoring Data – Great Sand Dunes NP