Download
1 / 16
170 likes | 644 Views
Matrices. Transition matrices. Powers of matrices. Only square matrices can be raised to a power. If. On a CAS calculator. Define Type to get the answer. If Find Find. Markov Systems and Transitions Matrices. See Worked Example 18 on p.852 The information can be summarised :

E N D
Matrices Transition matrices
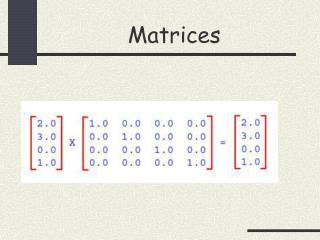
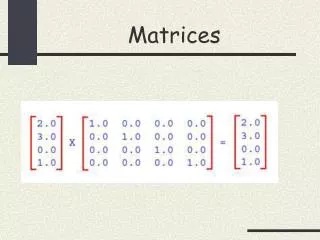
Powers of matrices • Only square matrices can be raised to a power. • If
On a CAS calculator • Define • Type to get the answer
If • Find • Find
Markov Systems and Transitions Matrices • See Worked Example 18 on p.852 • The information can be summarised : • 75% of Store A’s customers return there next month. The other 25% change to Store B. • 80% of Store B’s customers return there next month. The other 20% change to Store A. • Fill in the two way frequency table:
Transition diagrams • Express the 2-way frequency table as a transition diagram (see p.850)
How many customers are expected at the store at the end of 2 months if A and B each had 300 customers initially? • Markov systems let us predict future events given information about current states.
300 customers in each store is called the initial state or S0. This is the state of the problem at the start. • During month 1, a transition occurs: soe of A’s customers go to B and vice versa. The state after month 1, S1, can be found by: • S0 and T can be represented by matrices, with
Our transition matrix, T, is similar to our 2-way table. • Therefore after 1 month,
i.e. After 1 month, there are 285 customers at store A and 315 at store B. • Similarly, the state after month 2, S2, can be found by applying the same transition to S1. • Hence
How many customers are expected in each store after 10 months? • It is inefficient to repeat this operation 10 times. • Since the transition matrix is the same each time we can raise it to a power. • For instance, we could find S2 by calculating
Similarly, we can find S10 by calculating: • Rounding, there are 267 customers in store A and 333 in store B after ten months.
Find T50 and T51. How many customers are expected in each store after 50 months? After 51 months? • T50 = • T51= • S50= • S51=
When T is raised to large powers, the transition matrices start to look the same (T50=T51). This form of the transition matrix is called the steady state or long term transition matrix, T∞. • The states S50 and S51 also look identical. When this happens, the problem has reached a steady state. • We can use large powers of T to test whether the steady state has occurred.
Note: There is no steady state if T2contains any zeros. • In our problem, the steady state means that we can expect 267 customers in shop A and 333 in shop B in the long term.
Worked example 19 on p.854 • Exercise 16F: 1, 2, 3, 4, 6, 7, 9, 10, 11, 13, 15, 16, 17, 21, 22

![[MATRICES ]](https://cdn4.slideserve.com/144276/matrices-dt.jpg)