Download
1 / 15
150 likes | 274 Views
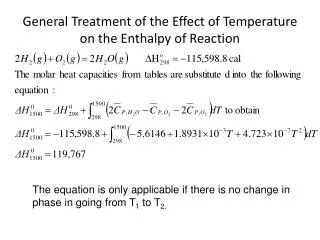
The Effect of Age on Reaction Time. Rose Seabrook. Problem: How does the age of a person affect their reaction time? Hypothesis: If a person is in the age range 10-25 years old, then they will have the fastest reaction time. Basic Concepts. Reaction Time

E N D
The Effect of Age on Reaction Time Rose Seabrook
Problem: How does the age of a person affect their reaction time? Hypothesis: If a person is in the age range 10-25 years old, then they will have the fastest reaction time.
Basic Concepts • Reaction Time • Interval of time between application of a stimulus and detection of response • Visual Cortex • Visually processes information and patterns • Motor Cortex • Plans, controls, executes voluntary functions • Reticular Formation • Filters incoming stimuli • Governs the functions of major organisms
Purpose of Experiment To discover why people in the age group 10-25 are better in sports, but, are more likely to get into car accidents.
Design Diagram Title: The effect of the age of a person on their reaction time Hypothesis: If a person is in the range 10- 25 years old then, they will have the fastest reaction time. IV: age
Design Diagram Cont. DV: Distance Ruler Falls (cm) Constants: height ruler is dropped from, height at which the person catches the ruler, and the weight of the ruler.
Results Cont. Averages • 10-25: 14.9 • 26-35: 16.6 • 36-45: 17.3 • 46-55: 19.3 • 56-70: 24.15
Statistical Analysis • data is of significance because the p value is <.05 • 1/1000 chance that data occurred by chance
Conclusions • Hypothesis Supported • 10-25 have a faster reaction time • Reticular Formation • Tasks become routine, brain receives less stimulation, lower levels of activity • Slows down memory and reaction time as you age • Visual and Motor Cortex • Slow down with age
Sources of Error • Area Watched • Ruler or hand • Attention Span • Readiness • Human Error • Measurement • Alcohol Influence • Inhibits reaction time
Improvements • Designate an area to watch • Warn subject when ruler will be dropped • No alcohol in subjects system
Extensions and Applications • Alcohol content on reaction time • Gender on reaction time • Driving • Sports