Download
1 / 28
280 likes | 462 Views
Atlanta Regional Commission Tom Weyandt, Department Director Comprehensive Planning May 2008. Program Summary. The purpose of the RideSmart program is to reduce: The number of single occupant vehicles Vehicle miles traveled (VMT) Congestion mitigation

E N D
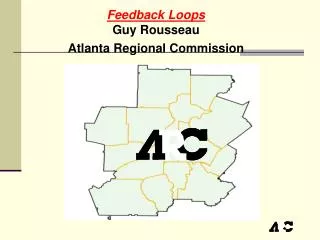
Atlanta Regional Commission Tom Weyandt, Department Director Comprehensive Planning May 2008
Program Summary • The purpose of the RideSmart program is to reduce: • The number of single occupant vehicles • Vehicle miles traveled (VMT) • Congestion mitigation • Emissions that are precursors to the formation of ozone • CMAQ funding allocated through GDOT
RideSmart Services • Regional carpool and vanpool partner matching • Assisted nearly 31,000 commuters actively seeking carpool/vanpool partners in 2007 • Regional Guaranteed Ride Home (GRH) program • More than 2,700 alternative mode commuters were provided a GRH in 2007
RideSmart Services • New! Bike Buddy Program • Matching bike-to-work partners • Pilot in Emory area • In coordination with CCTMA, Bike Emory and Atlanta Bicycle Campaign • New! SchoolPool Program • Matching parents of school-aged children • Public School pilot in Alpharetta
RideSmart Services • MyRideSmart.com • The MyRideSmart.com website serviced approximately 35,067 unique visitors in 2007 • Park & Ride comprehensive map using Google Earth • Regional management with eleven employer service organizations (ESOs)
Study Funding • $10 million over 10 years for studies • $500 million for transportation funding • 86 Studies • - 74 funded by ARC • - 12 grandfathered • 33 supplemental studies • $7.1 million in study funding • $1.5 million in supplemental funding • $132 million in transportation funding • $140+ million in total funding
Completed LCI Studies Atlanta – 14 Cherokee – 4 Clayton – 5 Cobb – 11 DeKalb – 15 Douglas – 2 Fayette - 2 Fulton – 14 Gwinnett – 11 Henry – 2 Rockdale – 1 Outside – 5 Total – 86
Development Numbers • LCI communities reported 722 developments: • 363 are complete • 176 are planned • 150 under construction The LCI developments result in: • Over 62,000 residential units • 9,492 hotel units • Over 12 million sq ft of commercial retail space • Over 40.2 million sq ft of office space LCI Implementation Report to be updated in 2008
LCI Transportation Funding • FY03 first year transportation funds available • $132 million programmed between FY 2003-2011 for design, right-of-way and construction projects • Funds distributed to 83 projects in 50 LCI communities • 28 projects are under construction or have been constructed to date • 33 projects are advancing • 10 projects are “of concern”
LCI Transportation Funding • Pedestrian Facilities – 58% • Multi-Use Trail – 6% • Bike/Ped Facility – 14% • Roadway Operations – 9% • Roadway Capacity – 3% • Transit Facilities – 9%
INDEX Modeling • Computer modeling to measure impact of land use changes identified in LCI plans • Measures existing development vs. LCI plan build-out • INDEX software used with indicators focusing on 4 Ds: • Density = percent change in pop/emp per sq mile • Diversity = how diverse the study area is compared to the region • Design = how complete the sidewalks and density of the street network • Destinations = how accessible the study area is to the region
Transit Planning Board (TPB)Regional Transit Vision “The TPB will develop a regional transit plan including a comprehensive financial plan”
Regional Travel Demand • Travel demand: • Varies by corridor • Varies within corridors • Demand signals appropriate service levels and transit modes for corridors
Concept 3 • Activity center focused • Expanded rail network to provide reliable travel times • Extensive BRT, express and intercity bus network • Cross region connectivity • Expanded local bus and activity center circulators • Truly multi-modal
Cost of Transit(2030 Order of Magnitude Estimates)* • Cost to Build = $16 billion • $1.20 - $1.30 per household/day** • Costs to Operate & Maintain = $12 billion • $0.90 - $1.00 per household/day** • Cost to Operate & Maintain existing system=$26 billion • $1.95 - $2.10 per household/day** • Total to Build, Operate & Maintain = $54 billion • $4.05 - $4.40 per household/day** * Range is whether counting 10 county or 13 county region **Assumes 2010 ARC estimated household, decreases as number of households increases
For more information or to make comments contact: Cheryl King Transit Planning Board Director 404-463-0311 CKing@TPB.ga.gov www.tpb.ga.gov
Questions? • Contact Us • Tom Weyandt • www.atlantaregional.com