Download
1 / 17
170 likes | 240 Views
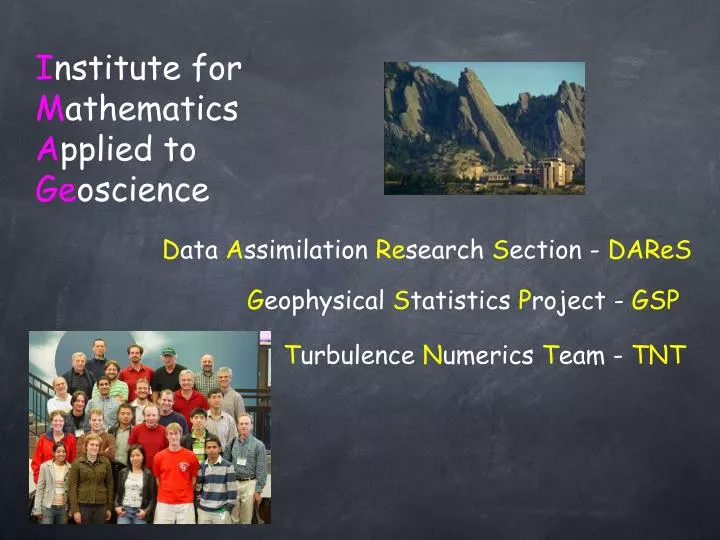
I nstitute for M athematics A pplied to Ge oscience. D ata A ssimilation Re search S ection - DAReS. G eophysical S tatistics P roject - GSP. T urbulence N umerics T eam - TNT. Your typical ensemble. Ensemble mean = waste of time. GSP - statistically blending winds. QuikSCAT

E N D
Institute forMathematicsApplied toGeoscience Data Assimilation Research Section - DAReS Geophysical Statistics Project - GSP Turbulence Numerics Team - TNT
GSP - statistically blending winds QuikSCAT Launched June 1, 1999 ~800 km altitude (~100 min orbit) 1800 km-wide swath about 400,000 measurements/day graphics by JPL
GSP -Statistically Blending Winds Resulting wind field with proper energy decay 6144 ‘observations’ every 6 hours (unrealistically smooth) Gradient (important to ocean circulation) ~ 40,000 observations every 6 hours (dense, but ‘gappy’) energy falls off too much energy falls off perhaps not enough
GSP Animation of E-W wind field created by synthesizing gridded winds and scatterometer (satellite) winds. The striping indicates the areas sampled by the scatterometer. Technique remains faithful to the data. Low standard deviation in data-dense regions.
Data Assimilation Research Section - DAReS Data assimilation exploits the information in observations to ‘steer’ a numerical model. Put another way, it ‘confronts’ a numerical model with observations. Simply running one numerical weather prediction model has been driving supercomputer research. Our computational challenge is to run MANY (~100) instances of the numerical models (CAM, WRF, ...) simultaneously.
* Many low-order models: Lorenz 63, L84, L96, etc. * Global 2-level PE model (from NOAA/CDC) * NCAR’s CAM 2.0 & 3.0 (global spectral model) * NCAR’s WRF (regional) * GFDL FMS B-Grid GCM (global grid point model) Forward Operators and Datasets Many linear, non-linear forward operators for low-models U, V, T, Ps, Q, for realistic models Radar reflectivity, GPS refractivity for realistic models Observations from BUFR files (NCEP reanalysis flavor) Can create synthetic (i.e perfect model) observations for all Data Assimilation Research Testbed : DART
Turbulence is one of the last unsolved classical physics problems. GASpAR Geophysical-Astorphysical spectral element adpative refinement.
GASpAR Numerical methods that minimize dissipation. Flexible framework for accurate simulation of turbulence Objects are structured to facilitate parallel computation. Dynamic refinement gives a speedup of 5-10X over fixed grids with comparable accuracy. Objected-oriented h-adapted code for simulating turbulent flows.
Elements Fields Equation Solvers Spectral Element Method operators Bases GBLAS Hierarchical. How does GASpAR do it? Adaptive refinement based on error estimates Mortar objects
Mortar Objects An unambiguous representation of the field at parent/child boundaries based on interpolation.
Dynamically adaptive geophysical fluid dynamics simulation using GASpAR Simulation of three vortices Refinement done on a component of velocity.