Download
1 / 16
170 likes | 244 Views
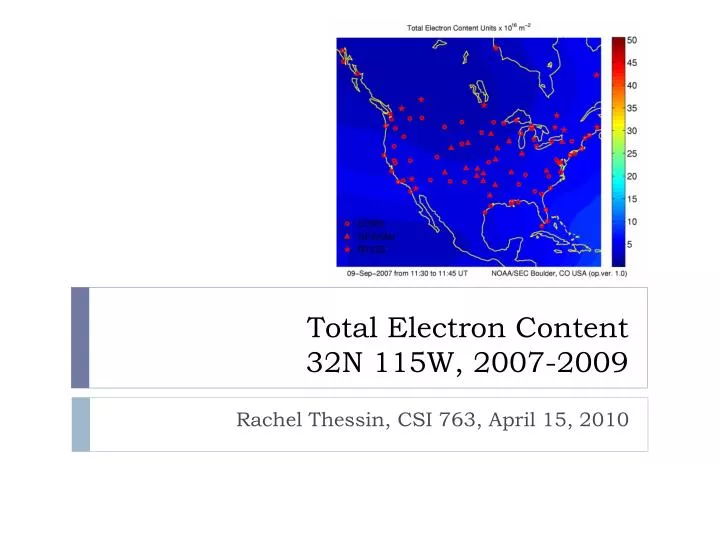
Total Electron Content 32N 115W, 2007-2009. Rachel Thessin, CSI 763, April 15, 2010. Data Overview. US TEC data from the National Geophysical Data Center Two data types: Ground GPS: CORS, RTIGS Sat GPS: GPS/Met Vertical TEC grids 1 deg x 1 deg 15 min resolution Oct 2004 – present

E N D
Total Electron Content32N 115W, 2007-2009 Rachel Thessin, CSI 763, April 15, 2010
Data Overview • US TEC data from the National Geophysical Data Center • Two data types: • Ground GPS: CORS, RTIGS • Sat GPS: GPS/Met • Vertical TEC grids • 1 deg x 1 deg • 15 min resolution • Oct 2004 – present • Each day: 26 MB compressed; 64 MB uncompressed • TEC: total electron content (integral of electron density) http://www.ngdc.noaa.gov/stp/IONO/USTEC/
Time Series • Extracted TEC 2007-2009 at 32N 115W • Overlaps with 12/2009 5.8 mag earthquake
Data Expectations • TEC is a function of • Solar / geomagnetic activity • Time of day • Day of year (season) • Lat / Lon / Alt • 2007 – 2009: Solar minimum • Relatively flat solar activity across three years http://solarscience.msfc.nasa.gov/images/ssn_predict_l.gif
Literature Review, 1 of 2 • Dautermann et al ("Investigation of ionospheric electron content variations before earthquakes in southern California, 2003 – 2004," Journal of Geophysical Research, VOL. 112, 2007) • 11 year, 1 year, 27 day, 1 day, 12 hr
Literature Review, 2 of 2 • Bilitza (2001) • “International Reference Ionosphere 2000,” Radio Science, v. 36, n. 2, pp 261-275, March-April 2001 • E region • Solar influenced • 24-hr periodicity related to SZA • F region • plasma is transported along magnetic field lines • 24-hr dependence related to LT • External drivers • solar irradiance (11-year cycle) (and hence the use of F10.7 and twelve-month running mean of SSN as inputs) • Conclusion: IRI will miss the 27-day periodicity in the data • These periodicities are ephemeral and caused by “random” events.
Time Series • 2007-2009 at 32N 115W • Flat with daily varaitions
Data Gaps • 120 gaps among 103,000 data points • 18 1-minute gaps and 112 gaps longer than 16 minutes • Linear Interpolation
Data Distribution • TEC varies daily • Sinuosoidal appearance • Most data values at peak or trough bimodal data distribution • Bounded on lower end, unbounded on upper end broader upper peak
Autocorrelation • Long correlation lag • Values correlated with counterparts one year later • Yearly cycle + flat solar activity • Short correlation lag • Large variance in correlation small lags apart • Daily variation in TEC
Raw Periodogram • Signal at period of 1 day; no other signals • Aliasing of this signal • Data set is too short and flat to see 1-year, 11-year signals • 12-hour – 1/(1/2 day) = 2 day-1; 27-day – 1/(27 days) = 0.037day-1 • 1-year – 1/(365 days) = 0.0027 day-1
WelchsPeriodogram • 8 equal-sized, overlapping windows with a Hamming function shape leads to less high-freq noise • 1-day and 12-hr signals visible
Welch’s Periodogram, 60-day window • Smaller window less high-freq noise 12 hr signal becomes more visible
Welch’s Periodogram, 10-day window • Smaller window less high-freq noise 12 hr signal becomes more visible • No longer physically feasible to see 1 year or 27day signals
Error on Periodogram • Bootstrap, n = 1000, l = 45 days • Peak at 1 day is statistically significant, as is peak at 12 hours • Aliasing peaks seem almost significant – meaning of 3 hour period?
Error on Welch’s • Bootstrap, n=1000, l = 45 days • 1 day and 12 hour signals statistically significant