Download
1 / 10
100 likes | 113 Views
Genetic Toggle Switch in E. Coli Collins Lab (2000). Allen Lin. Main Idea. Bistable switch Repressor inhibits transcription, inducer promotes transcription (by inhibiting repressor). Toggle Model. u = [repressor 1] v = [repressor 2] alpha1 = effect rate of synthesis of repressor 1

E N D
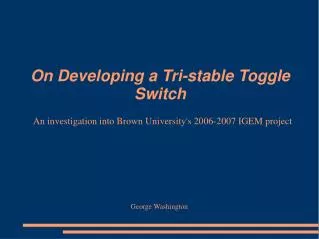
Genetic Toggle Switch in E. ColiCollins Lab (2000) Allen Lin
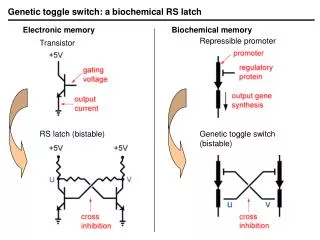
Main Idea • Bistable switch • Repressor inhibits transcription, inducer promotes transcription (by inhibiting repressor)
Toggle Model • u = [repressor 1] • v = [repressor 2] • alpha1 = effect rate of synthesis of repressor 1 • alpha2 = effect rate of synthesis of repressor 2 • beta = cooperatively of repression of promoter 2 • gamma = cooperatively of repression of promoter 1 • Sigmodal shape from cooperative repression of transcription greater than 1 • Rates of synthesis of two repressors needs to be balanced
Plasmid • pTAK class • Lac repressor (LacI) with Ptrc-2 promoter • Temp-sensitive Lambda repressor (cIts) with PLs1con promoter • Switched by IPTG or thermal pluse • pIKE class • Lac repressor (LacI) with Ptrc-2 promoter • Tet repressor (tetR) with PLtetO-1 promoter • Switched by IPTG or aTc • Transcriptional efficiencies: PLs1con > Ptrc-2 > PLtetO-1 • Rates of synthesis of repressors changed by modifying RBS (RBS1 in particular)
GFP • Gpmut3 gene downstream of Ptrc-promoter • Transcription of Ptrc-2 >> GFP expressed (high) • Transcription of P1 >> GFP not expressed (low)
Bistability in 5 plasmids • 5 bistable toggle plasmids • pIKE differ from expected • Tet repressor (in pIKE) weaker than lambda repressor (in pTAK). PtetO-1 promoter in pIKE105 not reduced enough
Long term bistability • pTAK117
Threshold • After 17-h induction • pTAK117 (red) exhibits quasi-jump • pTAK102 (blue) control exhibits sigmoidal curve • 3a and 3b high and low of bimodally distributed curves • Figure b - w/o gene expression variability
Switching Time • Switching time depends on rate of elimination of repressor protein • Low to high – dilution by cell growth of IPTG-bound Lac repressor • High to low – thermal destabilization of temp-sensitive lambda repressor • Faster to switch to low state than to high state