Download
1 / 12
130 likes | 277 Views
Population and Poverty. Mr. Henry AP Economics. Census. Is an official count of all people living in the U.S. including their place of residence Required by the Constitution of the United States First conducted in 1790 Occurs every 10 years

E N D
Population and Poverty Mr. Henry AP Economics
Census Is an official count of all people living in the U.S. including their place of residence • Required by the Constitution of the United States • First conducted in 1790 • Occurs every 10 years • Used to decide the number of representatives that each state elects to Congress. The members of the House of Representatives serve two-year terms representing the people of a district. Congressional districts are apportioned to states by population using the United States Census results, provided that each state has at least one congressperson. Each state regardless of population has exactly two senators.
Two Classifications • Urban Population- People living in incorporated cities, villages, or towns with 2,500 or more inhabitants • Rural Population-makes up the remainder of the total including those persons who live in sparsely populated areas along the fringes of cities • How would you classify the following towns or cities? Zelienople, Cranberry, Portersville, Prospect • Zelienople – 2000 (4,123); 2010 (3,812) • Cranberry – 2000 (23,625); 2010 (28,098) • Portersville – 2000 (268); 2010 (235)
Rate of Population Growth • Today the rate of growth is less than 1.0 percent annually • In colonial times the average household was 5.8 people • 1960 3.3 people • Today 2.6 people • Why do you think the size of American households are shrinking?
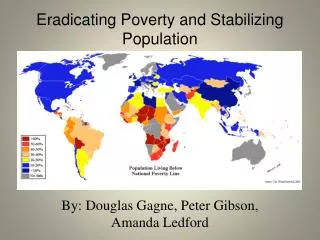
What Problems are there with Population Growth? Changes can distort GDP If a country grows faster than its output, per capita output grows more slowly and country could end up with more mouths than it can feed. If a country grows too slowly, there may not be enough workers to sustain the economy Support programs / Entitlements for its citizens Infrastructure- highways, levees, mass transit communications system, electricity, water, sewer and other public goods needed to support population
Age and Gender • Baby Boom- high birth rate years from 1946 to 1964 make up a sizeable portion of current population • The problem posed by the “baby boomers”? • is that they are reaching retirement and starting to collect Social Security and Medicare. These are transfer payments that will place a large burden on the young working population
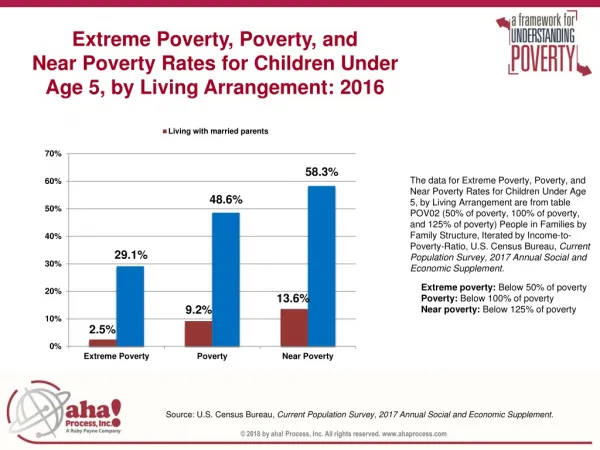
Poverty Threshold • Poverty Threshold- annual dollar income used to determine the number of people in poverty • In 1776 Adam Smith in the Wealth of Nations argued that poverty is the inability to afford, "not only the commodities which are indispensably necessary for the support of life, but whatever the custom of the country renders it indecent for creditable people, even of the lowest order, to be without." • Charles Booth, a pioneering investigator of poverty in London at the turn of the 20th century, popularized the idea of a poverty line, a concept originally conceived by the London School Board.
Lorenz Curve & distribution of income Max Lorenz- American economist who published this paper when he was a doctoral student at the University of Wisconsin–Madison. His doctorate (1906) was on 'The Economic Theory of Railroad Rates' and made no reference to perhaps his most famous paper. • Lorenz Curve- was developed by an American statistician and economist named Max Lorenz when he was a graduate student at the University of Wisconsin. • Its Purpose?- showed how the actual distribution of income differs from an equal distribution in order to display income inequalities
Why is incomes vary? Reasons why incomes vary: Education Prior Wealth Tax Law Changes Decline of Unions More Service Jobs Monopoly Power Discrimination Changing Family Structure. What influence does wealth have on life choices (ie what are the rich able to do that others cannot?)
Anti-Poverty Programs • Welfare – Economic & social assistance from the government or private agencies because of need • Food Stamps – Portion of Farm Bill; government issued coupons that can be exchanged for food (1964 – based solely on income) • Medicaid – Joint federal-state medical insurance program for low-income people • Workfare – Welfare in exchange for work; this means getting unemployed people into paid work, eliminate lack of recent workforce experience, reducing or eliminating welfare payments to them, and creating an income that generates taxes.
Anti-Poverty Programs • Temporary Assistance for Needy Families (TANF) – Cash payment for death, absence, or disability of parent • Supplemental Security Income (SSI) – Cash payments to blind or disabled over 65 • Earned Income Tax Credit (EITC) – Tax credits to low income workers • Enterprise Zones – Free of some laws established in low income / depressed areas
Anti-Poverty Programs • The list of Anti-Poverty programs above has created much debate in recent years in our country. • If you were to run for political office, what program(s) would you make an adjustment(s) to? • Which of the programs do you feel are effective?