Download
1 / 14
150 likes | 424 Views
Galveston Bay Atmospheric Deposition Study. Anil K. Katamreddy CE 394K.3 GIS in Water Resources Fall 2003 University of Texas at Austin. Airshed Transport. Wet Deposition. Dry Deposition. Wet Deposition. Dry Deposition. Estuary. Coastal Waters. Watershed. Atmospheric Deposition.

E N D
Galveston Bay Atmospheric Deposition Study Anil K. Katamreddy CE 394K.3 GIS in Water Resources Fall 2003 University of Texas at Austin
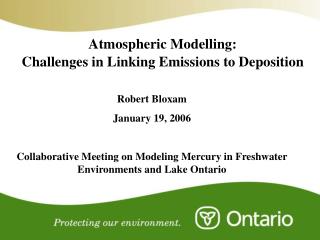
Airshed Transport Wet Deposition Dry Deposition Wet Deposition Dry Deposition Estuary Coastal Waters Watershed Atmospheric Deposition Indirect Input Direct Input to water surface
Galveston Bay Major Air pollution emission sources are located around this area
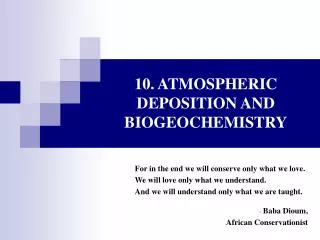
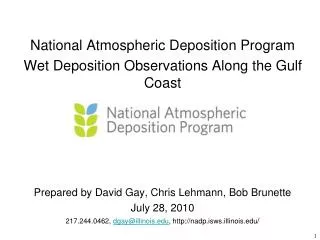
Wet Deposition Monitoring Network National Atmospheric Deposition Program (NADP) • Available Data • Annual and Seasonal Wet Deposition flux rates (kg/ha/yr) of Ca, Mg, NO3, NH4, SO4 ions and Inorganic Nitrogen • Annual and Seasonal Mean Concentrations (mg/L) of Ca, Mg, NO3, NH4, SO4 ions NADP Monitoring Network
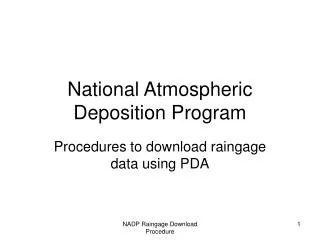
Spatial Interpolation: Kriging Method 3. Spatial Analyst: Zonal Statistics 1. Geostatistical Analyst: Kriging Prediction Map 4. Aggregated Prediction Map: Galveston Bay 2. Prediction Map Extent: Galveston Bay
Future Work: Dry Deposition Flux Rate Calculations NOAA inferential model : calculates the gas and particle dry deposition velocities (vdg, vdp) (Valigura, 1995) Deposition Flux Rate (FNHx) calculations (Asman et. Al, 1994) Required Data : • Ambient air concentrations (Cair) of ammonia and ammonium • Ammonia equilibrium concentrations (Ceq) • Henry’s Law constant (HNH3) has units of M atm-1, the ammonium disassociation constant (KNH4) has units of M, and salinity (S) has units of ppt
Dry Deposition Monitoring Network Texas Commission on Environmental Quality (TCEQ): Monitoring Stations around Galveston Bay National Dry Deposition Network: 70 Monitoring Stations; Only 1 Station in TX