Download
1 / 36
370 likes | 801 Views
A comparison of federalism in Canada and Australia . May 2006. 1. 2. 3. Current issues in intergovernmental relations. Variations on a (familiar) theme. Key differences. Contents. North-West Territories 0.1%. Yukon 0.1%. Nunavut 0.1%. Newfoundland & Labrador 1.6%. British Columbia

E N D
1 2 3 Current issues in intergovernmental relations Variations on a (familiar) theme Key differences Contents
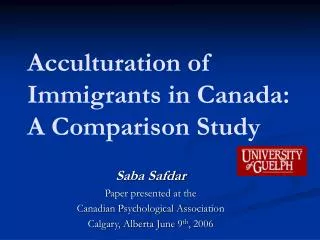
North-West Territories 0.1% Yukon 0.1% Nunavut 0.1% Newfoundland& Labrador 1.6% British Columbia 13.2% Alberta 10.1% Québec 23.5% Prince EdwardIsland 0.4% Ontario 38.9% Saskatchewan 3.1% Manitoba 3.6% Nova Scotia 2.9% New Brunswick 2.3% A quick overview of Canada Provinces and territories and % share of 2005population of 32.3 million 3
Northern Territory 1.0% Queensland 19.5% Western Australia 9.8% South Australia 7.5% New South Wales 33.3% Australian Capital Territory 1.6% Victoria 24.7% Tasmania 2.4% A quick overview of Australia States and territories and % share of 2005population of 20.4 million 4
1 Variations on a (familiar) theme
Parliamentary systems with strong executives • Westminster systems of government both federally and in States and provinces • Executives are particularly dominant in Canada, given that: • Canada’s elected House of Commons is seen as more legitimate than the unelected Canadian Senate • provincial legislatures are all unicameral • By contrast, all Australian jurisdictions (except Queensland) have retained elected upper houses that • are often not controlled by their respective governments • exert substantial checks and balances on governments 6
Autonomy of senior orders of government • Independent constitutional basis of authority of both federal and state/provincial governments • Few / no formal constraints on: • spending power of federal and state/provincial governments • taxation powers of federal and state/provincial governments • federal and state/provincial governments’ ability to borrow • Limited overlap of legislative / regulatory powers in theory… … but substantial entanglement in practice 7
Canada Australia Metropolitan (500K to1 million) 13.0% Metropolitan (over 1 million) 37.2% Metropolitan (over 1 million) 60.8% 8.3% 9.5% Large urban (250k to 500k) Under 100K 33.8% Under 100K 25.6% 4.0% 7.6% Small urban (100k to 250k) Both are highly urbanized societies… Resident population by size of metropolitan area 8
… despite different size of local governments • Canada and Australia are comparable in terms of degree of urbanization and size of major metropolitan areas • But: Australian and Canadian metropolitan areas are organized very differently: • in Australia, almost all large urban centres are divided into multiple local government jurisdictions • by contrast, Canada has many larger urban municipalities that achieve greater “critical mass” – but also many smaller (mostly rural) municipal governments 9
20% Australia Canada 15% 10% 5% 0% 1-2 K 2-4 K 4-6 K 6-8 K < 500 8-10 K 10-15 K 15-20 K 20-30 K 30-40 K 40-50 K 50-100K 500K-1 M 500-1000 100-150K 150-200K 200-250K 250-500K > 1 million … despite different size of local governments Many larger urban jurisdictions in Canada… Distribution of population by size of local government jurisdiction (%) 10
Canada total: 3,849 (avg population: 7,545) 1500 1,286 Australia total: 728 (avg population: 25,700) 1000 765 417 500 297 289 256 203 178 157 153 142 109 79 74 74 69 29 0 Avg pop (thousands): Tas NT SA Vic WA Qld NSW NF PE NS NB QU ON MB SK AB BC 20.2 16.2 2.8 59.6 13.1 22.4 36.4 22.3 1.6 1.2 12.2 2.8 5.6 27.2 5.2 1.2 9.8 … despite different size of local governments … but many smaller (rural) jurisdictions in Canada as well 11
Modest role for local governments in both countries • In both countries: • local governments are “creatures” of the states / provinces • “weak mayor” system predominates • local councillors usually act as “independents” (i.e. with diffuse, if any, party affiliations) • Local governments are highly dependent for their finances on a limited range of revenue sources, notably: • property taxes and user fees they levy themselves • transfers from senior levels of government 12
Canada Australia Federal Federal 44% 74% 8% 4% Provinces States 22% 48% Modest role for local governments in both countries Local government share of own-source revenues Local 13
Canada Australia Local Federal Federal 36% 59% 5% 11% Provinces States 36% 53% Modest role for local governments in both countries Local government share of own-purpose expenditures 14
Canada Australia Own-source revenues 84.1% 88.0% Statetransfers Provincial transfers 14.6% 4.6% 7.4% Federal transfers 1.3% Degree of local fiscal autonomy is similar… Local government fiscal autonomy 15
Canada Australia Social services6% Socialservices10% Debtservice4% Public order & safety2% Generalgov’t9% Recreation& culture15% Generalpublic services15% Recreation& culture12% Debtservice2% Other 4% Protection of persons & property17% Transport &communication25% Other11% Housing, health, education and environment25% Housing & community amenities24% Transport &communication19% … as are local expenditure responsibilities Local government expenditures 16
Indigenous issues also pose similar challenges… • Education, health and other socio-economic challenges • Small size / remoteness of many Indigenous communities • Small overall population (2-3%) and corresponding small political weight federally and in most States / provinces • Most indigenous people live in States / provinces – but much higher proportions in northern territories • High (and rising) levels of indigenous urbanization • Ongoing concerns over Indigenous governance 17
Canada Australia Australia • Historical “treaties of equals” with Indigenous allies (17th/18th centuries) • No treaties • Relationship grew less and less equal in 19th and 20th centuries • Unequal relationship from first contact • Aboriginal rights in addition to same rights as other citizens • Formal equality, but with special Indigenous needs acknowledged • Clear federal role (historically) as interlocutor • Commonwealth role as prime interlocutor came late (1960s) ....but with different histories of Indigenous relations 18
Canada Australia Australia • Constitutional recognition and treaty protection (since 1982) • No constitutional recognition • Modern treaties with First Nations • No treaties • Historical treaties also given new life by courts • High Court acknowledgement of Indigenous land rights • Indigenous interlocutors (usually) obvious • Less clear who Indigenous “self” is in “self-government” ....but with different histories of Indigenous relations 19
2 Key differences
Greater heterogeneity in Canada’s population • Unlike Australia, Canada has: • two major languages and a long evolving French-English partnership (but also long-standing French-English tensions) • a complex historical relationship with First Nations • recognized collective rights (in addition to individual rights) in its Constitution Act, 1982 • To a greater extent than Australia, Canada is also home to significant regional identities… … including long-standing regional “alienation” / grievances 21
Different intergovernmental institutional mechanisms In Canada: • The Council of the Federation is an inter-provincial/territorial body consisting of provincial Premiers only In Australia: • The Council of Australian Governments (COAG) is the peak intergovernmental forum in Australia…: … comprising the Prime Minister, State Premiers, Territory Chief Ministers and the President of the Australian Local Government Association (ALGA) • COAG Secretariat is located within the federal Department of the Prime Minister and the Cabinet 22
Canada Australia Corporateincome taxes15% Corporateincome taxes19% Personalincome taxes 48% Personalincome taxes 53% Sales taxes15% Excisetaxes & duties14% Excisetaxes & duties7% Payrolltaxes9% Other11% Superannuationfunds3% Other6% Similar sources of federal government financing … Federal taxes and other revenue sources 23
75% 75% 65% 66% Expenditures Revenues 61% 60% 53% 45% 45% Federal share of direct spending Federal share of own-source revenues 50% 50% 41% 37% 37% 25% 25% 0% 0% Switzerland Canada Germany Australia USA Switzerland Canada Germany Australia USA … but Canada is much more fiscally decentralized 24
Property taxes 4% Investment income 11% Consumption taxes 24% Payroll taxes 3% Sales of goods & services 3% Motor Vehicle Licences 1% 11% Health & drug insurance 1% Other 6% Incometaxes 29% Federaltransfers18% Canadian provinces are more fiscally autonomous Highly diversified provincial revenues in Canada... 25
Taxes on property & financial / capital transactions13% Interest income4% Taxes on provision of goods & services 6% Payroll taxes 9% Sales of goods and services 9% 32% Taxes on use of goods and performance of activities 5% Federaltransfers*44% Other 10% Canadian provinces are more fiscally autonomous …versus less diversified Australian States revenues * Includes transfer of GST revenues to States 26
Standard deviation of population weighted fiscal disparities (in USD per capita at PPP) $2,000 $1,510 Revenue disparities Expenditure disparities $1,500 $1,020 $463 $1,000 $392 $303 $482 $500 NA NA NA $136 $0 Australia Germany United States Canada Switzerland Larger horizontal fiscal disparities in Canada… 27
Alberta Ontario British Columbia Saskatchewan Québec Manitoba Nova Scotia New Brunswick Prince Edward Island Newfoundland & Labrador -2000 0 2000 4000 -1000 1000 3000 -2000 0 2000 4000 -1000 1000 3000 … are significantly reduced through equalization Pre-equalization Post- equalization Revenuedisparities: $2,410 $2,410 $307 $307 -$150 -$173 -$482 -$150 -$690 -$150 -$1,007 -$150 -$1,324 -$150 -$1,469 -$150 -$1,683 -$150 -$1,784 -$150 28
Pre-equalization: Revenue disparities Revenue disparities Expenditure disparities Expenditure disparities Western Australia $146 $365 New South Wales $94 -$158 Australian Capital Territory $69 $747 Queensland $36 -$95 Victoria -$110 -$248 South Australia -$134 $431 Northern Territory $4,207 -$271 -$552 $341 Tasmania -2000 0 2000 4000 -2000 0 2000 4000 -1000 1000 3000 -1000 1000 3000 Australia’s much smaller horizontal disparities… 29
Revenue disparities Expenditure disparities Post-equalization: Western Australia $0 $0 New South Wales $0 $0 ACT $0 $0 Queensland $0 $0 Victoria $0 $0 South Australia $0 $0 Northern Territory $0 $0 Tasmania $0 $0 -2000 0 2000 4000 -1000 1000 3000 -2000 0 2000 4000 -1000 1000 3000 … are more fully equalized than in other federations 30
7 4 Oil production(millions of barrels / day) Natural gas production(trillions of cubic feet) 6 3 5 6.2 4 3.1 2 3 Canada 2 Australia 1 1 0 0 1.3 0.5 Revenue disparities in part reflect oil & gas revenues Canada’s oil & gas production is larger… 31
Revenue disparities in part reflect oil & gas revenues … and its oil & gas revenues are regionally concentrated • Most Australian oil & gas production is offshore, with most resulting revenues flowing to the federal government • e.g. virtually all revenues from production beyond the three-mile limit • By contrast, most Canadian production is from provincially owned onshore resources… … whose revenues flow mostly to provinces (especially Alberta) • Revenues from Canadian offshore oil & gas also accrue to provinces (pursuant to federal-provincial accords) 32
3 Current issues in intergovernmental relations
Similar issues in intergovernmental relations… • Modernizing and overhauling the delivery of health care: • core issues of improving access to care services, improving the supply, flexibility and responsiveness of the health workforce • Promoting national competitiveness, including coordination of: • national investments in postsecondary education and vocational training • national investments in infrastructure and transportation • Net inter-regional transfers resulting from equalization and other federal policies are a recurring source of controversy 34
… as well as some key differences • High natural resource prices are placing significant stress on Canada’s Equalization program • Provinces’ responsibility for most fast-growing health spending has raised growing concerns over vertical fiscal imbalance • Australia’s highly variable and often scarce water resources have made the National Water Initiative a key issue • Counter-terrorism and security issues are also significant recurring themes on the IGR agenda in Australia 35
Recent intergovernmental agreements CANADA • Early learning and child care agreements 2005 • Transfer of Federal Gasoline Tax 2005 • Equalization Framework Agreement 2004 • A 10 Year Plan to Strengthen Health Care 2004 AUSTRALIA • Australian Better Health Initiative 2006 • GST Distribution Agreement 2006 • Agreement on National Energy Market 2006 • Intergovernmental Agreement on Surface Transport Security 2005 36