Download
1 / 10
100 likes | 431 Views
ARGENTINA ESTRUCTURA DE LA POBLACION POR SEXO Y GRUPOS DE EDAD. Habitantes desnutridos por región entre 1990-92 y 2030. Med.Or. y Afr.sept. A.Lat. Caribe. Asia Merid. Africa Subsah. Este Asia. EXPECTATIVA DE VIDA Cambio 1970 - 2000. Enf. Card. Perinatología. Enf.Cor. OTRAS.

E N D
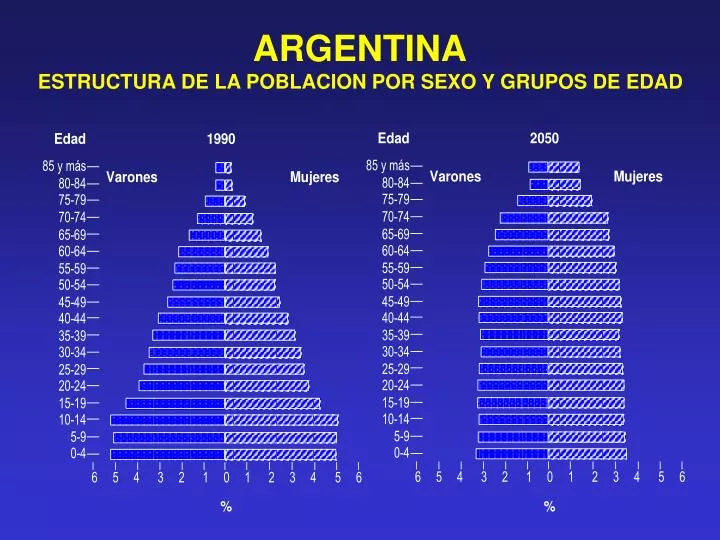
ARGENTINA ESTRUCTURA DE LA POBLACION POR SEXO Y GRUPOS DE EDAD
Habitantes desnutridos por región entre 1990-92 y 2030 Med.Or. y Afr.sept. A.Lat. Caribe Asia Merid. Africa Subsah. Este Asia
EXPECTATIVA DE VIDA Cambio 1970 - 2000 Enf. Card Perinatología Enf.Cor OTRAS ACV Accidentes Neoplasia EPOC HIV OTRAS AÑOS Claude Lenfant, MC NEJM 2003
ENFERMEDAD CORONARIA 1983 – 92 Hombres 35 – 64 a. Proporción (%) del cambio debido a: Recurrencia Mort. Mort. 60% (10a.) 000 Incidencia % Región 11.9 -23.0 59.2 North Karelia Kuopio Turku Prev. 48.6 76.6 29.1 2ria 39.5 46.4 11.7 1ria 253 145 115 FINMONICA St. Circulation Dic. 1996
Expectativa de vida – OMS Ajustada “sin discapacidad” Países n: 191. Prom global 56.8 a. (nacidos 1999) nº: 1 2 3 4 37 38 39 40 Países Japón Australia Francia Suiza Uruguay Croacia Argentina Costa Rica Años 74.5 73.2 73.1 73.0 67.0 67.0 66.7 66.7 nº: 114 115 116 117 188 189 190 191 Países Rep.Arabe Siria Egipto Vietnam Nicaragua Zambia Malawi Nigeria Sierra Leona Años 58.8 58.5 58.2 58.1 30.3 29.4 29.1 25.9 Mathers C. y col. Lancet 2001
NUEVA YORK DESFIBRILADOR (SEPT. 11) 9/11 .006 .004 EVENTOS (prob.) .002 0 Arshey A. Y col. Circulation 2003
FIN DE LA VIDA n: 20480 (6 países) Encuesta (médicos) Holanda % Suecia % Suiza % Respuesta Lugar fall. Hosp. Otro Fall. (n:) MS o inesp. No MS, no fin de vida Fin de la vida Eutanasia Suic, asistido Analg. con riesgo Interrup. de tmto. 75 33 67 5384 33 23 44 2.59 0.21 20 20 61 43 55 3248 30 34 36 0.23 0.23 21 14 67 37 63 3355 32 17 51 0.27 0.36 22 28 Van der Heide A. y col. Lancet, Agosto 2003