Download
1 / 10
100 likes | 195 Views
Confidence Interval for p, Using z Procedure. Conditions for inference about proportion. Center: the mean is ƥ . That is, the sample proportion ƥ is an unbiased estimator of the population proportion p.

E N D
Conditions for inference about proportion • Center: the mean is ƥ. That is, the sample proportion ƥ is an unbiased estimator of the population proportion p. • Shape: if the sample size is large enough that both np and n(1-p) are at least 10, the distribution of ƥ is approximately Normal. • Spread: ƥ = √ ƥ(1-ƥ)/n provided that the N≤10n Normality Independence
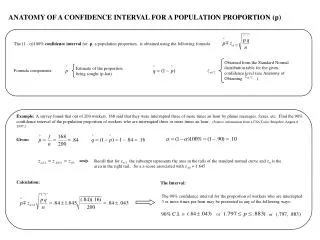
Binge Drinking in collegeestimating a population proportion Alcohol abuse has been described by college presidents as the number one problem on campus, and its an important cause of death in young adults. How common is it? A 2001 survey of 10, 904 random US college students collected information on drinking behaviour and alcohol-related problems. The researchers defined “frequent binge drinking” as having five or more drinks in a row three or more times in the past two weeks. Acoording to this definition, 2486 students were classified as frequent binge drinkers. That’s 22.8% of the sample. Based on these data, what can we say about the proportion of all college students who have engaged in frequent binge drinking?
… Binge Drinking in College Are the conditions met? SRS: SRS from 10, 904 US college students. Normality: the counts of YES and NO responses are much greater than 10: nƥ = (10, 904) (0.228) = 2486 n(1-ƥ) = 10, 904 (1-0.228)= 8418 Independence: the number of college undergraduates (the population) is much larger than 10 times the sample size n=10 904
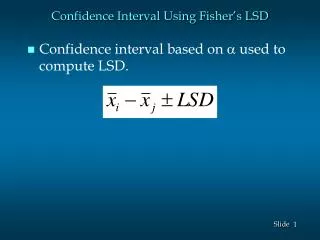
√ ƥ (1-ƥ) ƥ ± z* n Confidence interval for a population proportion
√ √ ƥ (1-ƥ) (0.228) (0.772) We are 99% confident that the proportion of college undergraduates who engaged in frequent binge drinking lies between 21.8% and 23.8% ƥ ± z* 0.228 ± 2.576 n 10,904 Estimating risky behavior Calculating a confidence interval for p C-level: 99% ƥ=0.228 n=10,904 z*= 2.576 0.228 ± 0.010 (0.218, 0.238)
Summary in Estimating the population µ and p • Confidence Interval
Minimum sample size: σ Test statistic: _ _ ∂ z* X ± z* √n √n ≤ E When population ∂is known (population standard Deviation) • A specific confidence interval formula is correct only under specific conditions. • SRS from the population of interest, • Normality of the sampling distribution, • Independence of observations(N≥10n)
Test statistic: _ _ s X ± t* √n When population ∂is NOT known(population standard Deviation) • margin of error of a confidence interval gets smaller as • the confidence level C decreases(z* gets smaller), • the population standard deviation σ decreases, and • the sample size n increases. with: df = n-1
√ √ Minimum sample size Test-statistic: p (1-p) p (1-p) p ± z* E ≥ z* n n ^ ^ ^ ^ ^ Estimating the population proportion (p) • A specific confidence interval formula is correct only under specific conditions. • SRS from the population of interest, • Normality: Rule of Thumb #2, • Independence Rule of Thumb #1