Download
1 / 28
280 likes | 429 Views
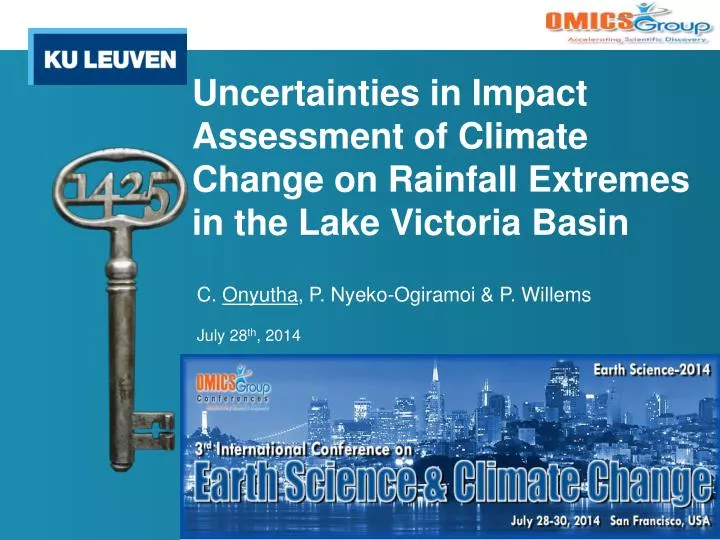
Uncertainties in Impact Assessment of Climate Change on Rainfall Extremes in the Lake Victoria Basin. C. Onyutha , P. Nyeko-Ogiramoi & P. Willems July 28 th , 2014. Why Lake Victoria Basin?. World LVB has 2 nd largest fresh water lake R. Nile Key source Extreme rainfalls

E N D
Uncertainties in Impact Assessment of Climate Change on Rainfall Extremes in the Lake Victoria Basin C. Onyutha, P. Nyeko-Ogiramoi & P. Willems July 28th, 2014
Why Lake Victoria Basin? World LVB has 2nd largest fresh water lake R. Nile Key source Extreme rainfalls episodes of floods + loss of lives + damage to prop. Population - so high - increased poverty Need for proper mgt of water resource 3rd International Conference on Earth Science and Climate Change
Data Rainfall 1961-2000 GCMs 14 – CMIP3 7 – CMIP5 Control/Hist. sim 20 – CMIP3 17 – CMIP5 Fut. Projections 53 – CMIP3 35 – CMIP5 Horizon 2049-2065 [2050s] 2081-2100 [2090s] Scenarios B1-550ppm of CO2 A1B-720ppm of CO2 A2-850ppm of CO2 Scenarios B1, A1B, A2 – CMIP3 rcp4.5, 6.0, 8.5 – CMIP5 3rd International Conference on Earth Science and Climate Change
Sources of uncertainty Those due to: • Sampling extremes • Inter-GCM differences • Difference between statistical downscaling methods 3rd International Conference on Earth Science and Climate Change
Uncertainty – sampling of extremes • Data limitation: sampling extremes • Risk based applications: - detailed representation - rainfall • Planning, Design & Operation: accurate descriptive study - extremes & • recurrence rates - long-term series • Extreme value analysis: Data scarce area - short-term series –extrapolation • Predictive uncertainty: - large - important to quantify for decision making 3rd International Conference on Earth Science and Climate Change
Quantifying uncertainty How ? • Extract independent extremes – AMS/PDS • Station 4 • POTs • EVD fitting • Resampling • POTs 3rd International Conference on Earth Science and Climate Change
Quantifying uncertainty How ? • Parameter estimation – GPD(loc, scale, shape) - fit distribution - Q-Q plot • Method – Weighted Linear Regression* • POTs • EVD fitting • Resampling • Station 5 • EVD fitting • *Onyutha, C. & Willems, P. (2014). Uncertainty in calibrating generalised Pareto distribution to rainfall extremes in Lake Victoria basin. Hydrol. Res. Doi:10.2166/nh.2014.052 3rd International Conference on Earth Science and Climate Change
Quantifying uncertainty How ? • Uncertainty on extremes– resampling - Jackknife – at 5% lev. Sig • Deleteith event from POTs of size w • Determine Ɵ(β,γ,xt) of EVD using (w -1) POTs • Steps (a) and (b) repeated w times • Rank w sets of Ɵ(β,γ,xt) in descending order • Upper and lower limits are determined from [0.025× w]thand [0.975× w]thƟ(β,γ,xt) • 95% CI determined using (e) above • POTs • EVD fitting • Resampling • Resampling 3rd International Conference on Earth Science and Climate Change
Quantifying uncertainty How ? • Uncertainty on extremes– resampling - Jackknife – at 5% lev. Sig • Station 5 • POTs • EVD fitting • Resampling • Resampling 3rd International Conference on Earth Science and Climate Change
Quantifying uncertainty How ? • Uncertainty on extremes– resampling - Jackknife – at 5% lev. Sig • Station 5 • Upper lim • POTs • EVD fitting • Resampling • Lower lim • Resampling 3rd International Conference on Earth Science and Climate Change
Quantifying uncertainty How ? • Uncertainty on extremes– resampling - Jackknife – at 5% lev. Sig • Station 5 • Upper lim • POTs • EVD fitting • Resampling • Lower lim • Resampling 3rd International Conference on Earth Science and Climate Change
Quantifying uncertainty How ? • Uncertainty on extremes– resampling - Jackknife – at 5% lev. Sig • Station 5 • 10-year quantiles • Upper lim • POTs • EVD fitting • Resampling • Lower lim • Resampling • 10 years < 40 data record length(1961-2000)– what if, say 100 years is used? 3rd International Conference on Earth Science and Climate Change
Climate change & Extremes 3rd International Conference on Earth Science and Climate Change
Inter-Global climate model differences • Climate change: Managers confronted - impact on hydro-clim. Extremes • Impact analysis : - not uncertainty-free - large differences exist IPCC model global warming projections • Source: IPCC (2013) report 3rd International Conference on Earth Science and Climate Change
Inter-GCM differences • Inter-compare GCMs: metrics - Bias, SEE, β-related • Empirical POTs A higher value of β means higher variations in extreme rainfall intensity 3rd International Conference on Earth Science and Climate Change
Inter-GCM differences • Bias versus SEE: - quantifying differences btn control runs & empirical series • Station 5 • Station 5 CMIP3 CMIP5 3rd International Conference on Earth Science and Climate Change
Inter-Global climate model differences • Control versus scenario:β– EVD scale parameter • Station 5 – CMIP3 3rd International Conference on Earth Science and Climate Change
Inter-Global climate model differences • Combining empirical, control and scenario: • Station 5 – CMIP3 3rd International Conference on Earth Science and Climate Change
Inter-GCM differences • Control versus scenario: change in β • Station 5 – CMIP3 3rd International Conference on Earth Science and Climate Change
Inconsistency of the GCMs What should I do? • Seive-out the GCMs: • Poor performance for: • CMIP5 by GFDL-ESM-2G_R1 at station 9 • CMIP3 • by at station(s) • CSIRO-MK3.0,R1 4 and 6 • GISS-AOM,R1 5 and 9 • GFDL-CM2.0,R1 5 • Decision: Downscale – consistent GCMs 3rd International Conference on Earth Science and Climate Change
Difference in statistical downscaling what methods? • Delta:changes in mean of rainfall PFut,d= future daily rainfall PObs,d = the observed daily series PSce,m = mean of GCM scenario series for month m PCon,m= mean of GCM control series for month m 3rd International Conference on Earth Science and Climate Change
Difference in statistical downscaling what methods? • Delta:changes in mean of rainfall PFut,d= future daily rainfall PObs,d = the observed daily series PSce,m = mean of GCM scenario series for month m PCon,m= mean of GCM control series for month m • Quantile based: Thresh. >1 mm/day…RelQp (simQP) Threshold<1 mm/day…AbsQp Scenario series - quantiles sx1 ≥ sx2 ≥ …≥ sxi…..≥ sxB; Control series quantiles cx1 ≥ cx2 ≥ …≥ cxi…..≥ cxB; Empirical quantiles ex1 ≥ ex2 ≥ …≥ exi…..≥ exB; Quantile pert. factors Qp1 ≥ Qp2 ≥ …≥ Qpi…..≥ QpB, relative Qpi= sxi/cxi 3rd International Conference on Earth Science and Climate Change
Difference in statistical downscaling what methods? • Delta:changes in mean of rainfall PFut,d= future daily rainfall PObs,d = the observed daily series PSce,m = mean of GCM scenario series for month m PCon,m= mean of GCM control series for month m • Quantile based: Thresh. >1 mm/day…RelQp (simQP) Threshold<1 mm/day…AbsQp Scenario series - quantiles sx1 ≥ sx2 ≥ …≥ sxi…..≥ sxB; Control series quantiles cx1 ≥ cx2 ≥ …≥ cxi…..≥ cxB; Empirical quantiles ex1 ≥ ex2 ≥ …≥ exi…..≥ exB; Quantile pert. factors Qp1 ≥ Qp2 ≥ …≥ Qpi…..≥ QpB, relative Qpi= sxi/cxi • Wet spell-based: similar to simQP but addition/removal of wet spell 3rd International Conference on Earth Science and Climate Change
Changes in rainfall extremes • Changes in rainfall extremes: Change [%] = (xe- xg)/xg*100 • where xe= 10-year empirical quantile • xg= 10-year GCM-based quantile 76 mm/day 90 80 81 70 96 93 92 91 3rd International Conference on Earth Science and Climate Change
100% Changes in rainfall extremes • Range of change in 10-year rainfall quantile – simQP using CMIP3 76 mm/day 81 70 96 90 93 91 92 80 25 3rd International Conference on Earth Science and Climate Change
100% Combining diff. sources of uncertainties • Station 7: • Sampling uncertainty: • upper limit: 118 mm/day • Estimated : 92 mm/day • Lower limit: 84 mm/day Inter-GCM differences – projection of changes[%]: 26 3rd International Conference on Earth Science and Climate Change
100% Conclusions • Need to quantify uncertainty in sampling of extremes– data limitation • Inter-GCM differences be used to select those to be downscaled • Choice of a downscaling method – objective driven 3rd International Conference on Earth Science and Climate Change
THANKS FOR LISTENING • ….. statistical testing of errors show their presence but not their absence charles.onyutha@bwk.kuleuven.be