Download
1 / 46
490 likes | 710 Views
PART I INTRODUCTION TO ECONOMICS. 1. The Scope and Method of Economics. CHAPTER OUTLINE. Why Study Economics? To Learn a Way of Thinking To Understand Society To Understand Global Affairs To Be an Informed Citizen The Scope of Economics Microeconomics and Macroeconomics

E N D
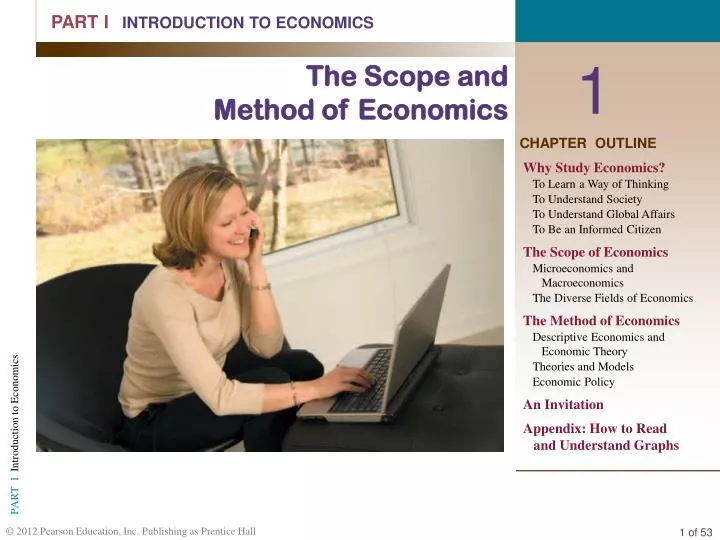
PART IINTRODUCTION TO ECONOMICS 1 The Scope andMethod of Economics CHAPTER OUTLINE Why Study Economics? To Learn a Way of Thinking To Understand Society To Understand Global Affairs To Be an Informed Citizen The Scope of Economics Microeconomics and Macroeconomics The Diverse Fields of Economics The Method of Economics Descriptive Economics and Economic Theory Theories and Models Economic Policy An Invitation Appendix: How to Read and Understand Graphs
economicsThe study of how individuals and societies choose to use the scarce resources that nature and previous generations have provided. Economics is the study of how individuals and societies choose to use the scarce resources that nature and previous generations have provided. The key word in this definition is choose. Economics is a behavioral, or social, science. In large measure, it is the study of how people make choices. The choices that people make, when added up, translate into societal choices. 2 of 37
Three fundamental concepts: Opportunity cost Marginalism Efficient markets To Learn a Way of Thinking Why Study Economics?
To Learn a Way of Thinking Why Study Economics? Opportunity Cost opportunity cost The best alternative that we forgo, or give up, when we make a choice or a decision. scarce Limited.
To Learn a Way of Thinking Why Study Economics? Marginalism marginalismThe process of analyzing the additional or incremental costs or benefits arising from a choice or decision. sunk costs Costs that cannot be avoided because they have already been incurred.
To Learn a Way of Thinking Why Study Economics? Efficient Markets—No Free Lunch efficient marketA market in which profit opportunities are eliminated almost instantaneously. The study of economics teaches us a way of thinking and helps us make decisions.
To Understand Society Why Study Economics? Industrial RevolutionThe period in England during the late eighteenth and early nineteenth centuries in which new manufacturing technologies and improved transportation gave rise to the modern factory system and a massive movement of the population from the countryside to the cities. The study of economics is an essential part of the study of society.
To Understand Global Affairs Why Study Economics? An understanding of economics is essential to an understanding of global affairs. To Be an Informed Citizen To be an informed citizen requires a basic understanding of economics.
E C O N O M I C S I N P R A C T I C E iPod and the World A sticker that says “Made in China” can often be misleading. Indeed, for the iPod, which is composed of many small parts, it is almost impossible to accurately tell exactly where each piece was produced without pulling it apart. From an economics point of view one often has to dig a little deeper to see what is really going on.
Microeconomics and Macroeconomics The Scope of Economics microeconomicsThe branch of economics that examines the functioning of individual industries and the behavior of individual decision-making units—that is, firms and households. macroeconomicsThe branch of economics that examines the economic behavior of aggregates—income, employment, output, and so on—on a national scale. Microeconomics looks at the individual unit—the household, the firm, the industry. It sees and examines the “trees.” Macroeconomics looks at the whole, the aggregate. It sees and analyzes the “forest.”
Microeconomics and Macroeconomics The Scope of Economics
Which of the following statements is correct? a. The aggregate price level is a subject of concern in microeconomics. b. A study of employment in the semiconductor industry would be categorized as a microeconomic study. c. The production and growth of output in the domestic economy is a microeconomic concern. d. Microeconomics is an in-depth study of aggregate economic behavior. e. Microeconomics includes the study of fiscal and monetary policies, or government policies designed to steer the economy in the right direction.
Which of the following statements is correct? a. The aggregate price level is a subject of concern in microeconomics. b. A study of employment in the semiconductor industry would be categorized as a microeconomic study. c. The production and growth of output in the domestic economy is a microeconomic concern. d. Microeconomics is an in-depth study of aggregate economic behavior. e. Microeconomics includes the study of fiscal and monetary policies, or government policies designed to steer the economy in the right direction.
The Diverse Fields of Economics The Scope of Economics Continued...
The Diverse Fields of Economics The Scope of Economics Continued...
The Diverse Fields of Economics The Scope of Economics
The Method of Economics positive economicsAn approach to economics that seeks to understand behavior and the operation of systems without making judgments. It describes what exists and how it works. Eg. “A poor coffee harvest will raise coffee prices and people will drink more tea” “The moon is made of green cheese.” normative economicsAn approach to economics that analyzes outcomes of economic behavior, evaluates them as good or bad, and may prescribe courses of action. Also called policy economics. Eg. “We should redistribute wealth from the rich to the poor”
Descriptive Economics and Economic Theory The Method of Economics descriptive economicsThe compilation of data that describe phenomena and facts. economic theoryA statement or set of related statements about cause and effect, action and reaction.
Theories and Models The Method of Economics modelA formal statement of a theory, usually a mathematical statement of a presumed relationship between two or more variables. variableA measure that can change from time to time or from observation to observation. Ockham’s razorThe principle that irrelevant detail should be cut away.
If you apply your own values to judge economic decisions, which category of economics would you be applying? a. Normative economics. b. Positive economics. c. Descriptive economics. d. Economic theory. e. Empirical economics.
If you apply your own values to judge economic decisions, which category of economics would you be applying? a.Normative economics. b. Positive economics. c. Descriptive economics. d. Economic theory. e. Empirical economics.
The Method of Economics Theories and Models All Else Equal: Ceteris Paribus ceteris paribus, or all else equalA device used to analyze the relationship between two variables while the values of other variables are held unchanged. Using the device of ceteris paribus is one part of the process of abstraction. In formulating economic theory, the concept helps us simplify reality to focus on the relationships that interest us.
Economic models are: • Precise representations of reality that include as many details as possible in order to accurately predict behavior. • Simplifications of reality that focus only on key relationships and ignore less relevant details. • c. General interpretations of cause and effect. • d. Analytical interpretations of economic behavior involving a good deal of the surrounding social and political structure of society. • e. Devices that usually make it impossible to isolate the impact of a single factor.
Economic models are: • Precise representations of reality that include as many details as possible in order to accurately predict behavior. • Simplifications of reality that focus only on key relationships and ignore less relevant details. • c. General interpretations of cause and effect. • d. Analytical interpretations of economic behavior involving a good deal of the surrounding social and political structure of society. • e. Devices that usually make it impossible to isolate the impact of a single factor.
The Method of Economics Theories and Models Expressing Models in Words, Graphs, and Equations • Methods of expressing the quantitative relationship between two variables: • Graphing (as presented in appendix) • Equations, for example: If over time U.S. households collectively spend, or consume, 90 percent of their income and save 10 percent of their income, we could then write: where C is consumption spending, Y is income, and S is saving. C = .90 Y and S = .10Y
The Method of Economics Theories and Models Cautions and Pitfalls The Post Hoc Fallacy post hoc, ergo propter hocLiterally, “after this (in time), therefore because of this.” A common error made in thinking about causation: If Event A happens before Event B, it is not necessarily true that A caused B. The Fallacy of Composition fallacy of compositionThe erroneous belief that what is true for a part is necessarily true for the whole.
The Method of Economics Theories and Models Testing Theories and Models: Empirical Economics empirical economicsThe collection and use of data to test economic theories.
The Method of Economics Economic Policy Criteria for judging economic outcomes: 1. Efficiency 2. Equity 3. Growth 4. Stability
The Method of Economics Economic Policy Efficiency efficiencyIn economics, allocative efficiency. An efficient economy is one that produces what people want at the least possible cost. Equity equityFairness.
The Method of Economics Economic Policy Growth economic growthAn increase in the total output of an economy. Stability stabilityA condition in which national output is growing steadily, with low inflation and full employment of resources.
An Invitation You cannot begin to understand how a society functions without knowing something about its economic history and its economic system. Learning to think in this very powerful way will help you better understand the world. As you proceed, it is important that you keep track of what you have learned in earlier chapters. This book has a plan; it proceeds step-by-step, each section building on the last. Make sure you understand where it fits in the big picture.
Which of the following criteria for judging economic outcomes refers to producing what people want at the least possible cost? a. Efficiency. b. Equity. c. Growth. d. Stability. e. All of the above.
Which of the following criteria for judging economic outcomes refers to producing what people want at the least possible cost? a. Efficiency. b. Equity. c. Growth. d. Stability. e. All of the above.
R E V I E W T E R M S A N D C O N C E P T S marginalism microeconomics model normative economics Ockham’s razor opportunity cost positive economics post hoc, ergo propter hoc scarce stability sunk costs variable ceteris paribus,or all else equal descriptive economics economic growth economic theory economics efficiency efficient market empirical economics equity fallacy of composition Industrial Revolution macroeconomics
A graph is a two-dimensional representation of a set of numbers, or data. A time series graph shows how a single measure or variable changes over time. CHAPTER 1 APPENDIX How to Read and Understand Graphs Time Series Graphs
CHAPTER 1 APPENDIX How to Read and Understand Graphs Time Series Graphs FIGURE 1A.1Total Disposable Personal Income in the United States: 1975–2009 (in billions of dollars)
Appendix CHAPTER 1 APPENDIX How to Read and Understand Graphs Graphing Two Variables on a Cartesian Coordinate System FIGURE 1A.2A Cartesian Coordinate System A Cartesian coordinate system is constructed by drawing two perpendicular lines: a vertical axis (the Y-axis) and a horizontal axis (the X-axis). Each axis is a measuring scale.
CHAPTER 1 APPENDIX How to Read and Understand Graphs Plotting Income and Consumption Data for Households FIGURE 1A.3 Household Consumption and Income A graph is a simple two-dimensional geometric representation of data. This graph displays the data from Table 1A.2. Along the horizontal scale (X-axis), we measure household income. Along the vertical scale (Y-axis), we measure household consumption. Note: At point A, consumption equals $22,304 and income equals $10,263. At point B, consumption equals $31,751 and income equals $27,442.
CHAPTER 1 APPENDIX How to Read and Understand Graphs Slope FIGURE 1A.4 A Curve with (a) Positive Slope and (b) Negative Slope A positive slope indicates that increases in X are associated with increases in Y and that decreases in X are associated with decreases in Y. A negative slope indicates the opposite—when X increases, Y decreases; and when X decreases, Y increases.
Refer to the figure below. The expression of the slope of the line between points A and B equals: a. b. c. d. e.
Refer to the figure below. The expression of the slope of the line between points A and B equals: a. b. c. d. e.
CHAPTER 1 APPENDIX How to Read and Understand Graphs Slope FIGURE 1A.5 Changing Slopes along Curves
Refer to the figure below. According to this graph, the relationship between hours of study time and points on the exam is as follows: • a. The relationship is first positive and then it turns negative. • b. Positive but diminishing. • c. Positive and increasing. • Negative. • Nonexistent.
Refer to the figure below. According to this graph, the relationship between hours of study time and points on the exam is as follows: • a. The relationship is first positive and then it turns negative. • b. Positive but diminishing. • c. Positive and increasing. • Negative. • Nonexistent.
CHAPTER 1 APPENDIX Some Precautions FIGURE 1A.6 National Income and Consumption It is important to think carefully about what is represented by points in the space defined by the axes of a graph. In this graph, we have graphed income with consumption, as in Figure 1A.3, but here each observation point is national income and aggregate consumption in different years, measured in billions of dollars.
A P P E N D I X R E V I E W T E R M S A N D C O N C E P T S Cartesian coordinate system graph negative relationship origin positive relationship slope time series graph X-axis X-intercept Y-axis Y-intercept