Download
1 / 21
210 likes | 375 Views
POL S 202: Intro to American Politics. “Voting Behavior” Week 7: May 11, 2010. American Politics in the News…. Interesting News Stories: 1. 2. 3. Voter Turnout Rates by Country. 8. 9. 10. 11. 12. 13. 14. 15. 1. 2. 3. 4. 5. 6. 7. Voting Behavior.

E N D
POL S 202: Intro to American Politics “Voting Behavior” Week 7: May 11, 2010
American Politics in the News… Interesting News Stories: 1. 2. 3.
Voter Turnout Rates by Country 8. 9. 10. 11. 12. 13. 14. 15. 1. 2. 3. 4. 5. 6. 7.
Voting Behavior • Voter Turnout: The percentage of citizens taking part in the election process; usually calculated as the number of voters who “turn out” on Election Day, divided by the number of adult citizens (eligible voters) • In 2008 there were 206 million eligible voters and 131 million cast a ballot
Voting Behavior Voter Turnout is Highest Nationwide elections – President Statewide elections – Governor / US Senate State elections – U.S. Congress / State legis Local elections – City Mayor / County Exec Local elections – City council only Local elections – School board / “other” Voter Turnout is Lowest What about Initiative elections?
Who Votes? • Research into voting has found that a clear association exists between voter participation and individual characteristics • Age • Educational attainment • Minority status (Black, Latino, Asian) • Income level • Job status • Religion
Who Votes? • A link is also found between voter turnout and environmental or contextual factors: • Two-party competition • Exposure to news / information • Political advertising • Mobilization drives • Candidate characteristics
The Expanding American Electorate • 1789: Adult, White Men, Property Owners • 1850: literacy laws & poll taxes enforced • 1866: 14th Amd. granted right to all 21 year old men • 1870: 15th Amd. granted right to vote to Blacks • 1920: 19th Amd. granted right to vote to women • 1964: 24th Amd. outlaws poll taxes • 1965: Voting Rights Act fully incorporates Black voters • 1971: 26th Amd. granted right to vote to 18 year olds • 1975: VRA Amendment to include language minorities (bilingual voting info)
The Contracting American Electorate • 2005, Georgia passes strict photo identification law to prove voter authenticity • 2006, U.S. District Court and U.S. Appeals Court issue injunction against Georgia law • 2007, Courts reinstate Georgia ID law • 2007, Indiana passes much more strict photo identification law • 2008, Supreme Court upholds Indiana law • 2010, GA court uphold GA law • Other states: Arizona, Michigan, Missouri, Ohio, Hawaii, Florida, Idaho, Louisiana, S. Dakota
Requirements for Voting • Citizenship (some exceptions) • 18 years or older • Resident of the jurisdiction (30 days) • Register to vote • Identification (varies by state) • Disqualified persons: prison inmates, convicted felons, election-law violators, and mentally incompetent
How do Voters Decide? • Generally, the same factors that influence voter turnout also influence vote choice on initiatives and for candidates: • Age • Education • Minority Status • Income level • Job status • Religion
2008 Vote Choice Breakdown McCain Obama Male 48% 48% Female 43% 56% White 55% 43% Black 4% 95% Latino 28% 72% Asian 35% 62% 18-29 32% 66% Over 65 53% 45% Under 30K 33% 65% $100-200K 51% 48%
Shifts from 2004 – 2008 Who was part of the Coalition? 04 08 Diff ~ African Americans 88 95 +7 ~ Latinos 57 72 +14 ~ Asian Americans 56 62 +6 ~ Young voters 54 66 +12 ~ College Educated 49 52 +3 ~ Non-College 47 54 +7 ~ Independents 49 52 +3 ~ First time voters 53 68 +15
How do Voters Decide? • While demographic characteristics show a pattern, the underlying factors are: • Party Identification • Perception of the candidates • Issue preference / congruence McCain Obama Democrat 10% 89% Republican 90% 9% MII: Terror 86% 13% MII: H.Care 26% 73%
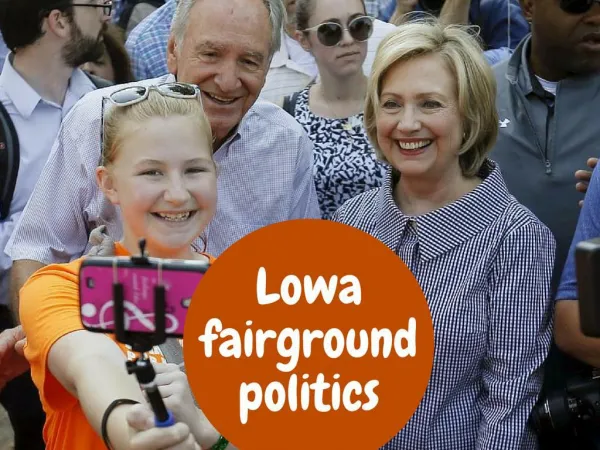
Voting Among College-Age • In 2004, efforts to mobilize youth were the most extensive ever • In 2008, efforts greatly increased • Colleges hosted events, youth-based groups targeted students on-campus • New strategies for mobilization, email, online, blogs, text msg, facebook, youtube • Encourage use of absentee ballot / vote-by-mail, register to vote online • Did it have a real effect on turnout?
Voting Among College-Age Source: U.S. Census, Current Population Survey, Nov 2000 & 2004
Voting Among College-Age Source: U.S. Census, Current Population Survey, Nov 2000 & 2004
Voting Among College-Age Source: U.S. Census, Current Population Survey, Nov 2000, 2004, 2008
Voting Among College-Age Source: U.S. Census, Current Population Survey, Nov 2000, 2004, 2008