Download
1 / 27
270 likes | 461 Views
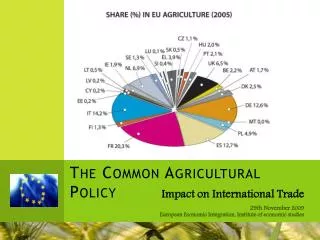
An overview on the CAPRI model Common Agricultural Policy Regionalized Impact Model. Wolfgang Britz, University Bonn. What is CAPRI ?. A “multi-purpose” modeling system for EU’s agriculture, allows to analyze market policies (administrative prices/tariffs/preferential agreements)

E N D
An overview on the CAPRI modelCommon Agricultural Policy Regionalized Impact Model Wolfgang Britz, University Bonn
What is CAPRI ? • A “multi-purpose” modeling system for EU’s agriculture, allows to analyze • market policies (administrative prices/tariffs/preferential agreements) • Premium systems/quotas/set-aside at regional level • Environmental policies (standards/market solutions) • Changes in exogenous drivers (population/inflation/exchange rates/consumption behavior/technical progress) • Regarding • supply/demand/trade flows • hectares/herd size/yields/input use • Producer & consumer prices, income indicators • Environmental indicators • Welfare effects including the EU budget for the Common Agricultural Policy (CAP)
What is CAPRI ? • Acronym means “Common Agricultural Policy Regionalised Impact” • Comprises • The underlying “data base” • The “economic model” • The software tools/code
CAPRI projects and funding • EU funded project 1997-1999, building upon experience with global trade models and models for Germany • First version operational 1999 • 2001-2004, new project CAP-STRAT, implementing the new global bi-lateral trade model and new environmental indicators • 2001/2002, since 2005: work on farm type module • 2004-2007, work on spatial dis-aggregation and expansion to EU27 and Western Balkans (CAPRI-Dynaspat) • 2009-2013, work on Rural Development and integration with regional CGEs (CAPRI-RD)
CAPRI projects and funding, continued • Since around 2002, increasing application of CAPRI in work packages of different research projects such as: • SEAMLESS (FP VI) • SENSOR (FP VI) • EU-Mercopol (FP VI) • EU-MedAgPol (FP VI) • CCAT (FP VI) • CCTAME (FP VII) • EC4MACS (EU-Life) • And application for policy impact assessment (e.g. Agenda 2000, MTR, sugar market reform, dairy market reform, bio-fuels) • Increasingly, link to other tools such as GTAP or Land-User Cover Change models
CAPRI clients and users • Main client is the EU Commission, directorates general for agriculture and for environment • Users are research institutions: universities, national research institutes and the Joint Research Centre of the EU • Over time, a rather stable network of core coders/users has developed
Projection CAPTRD CoCoMS data Eurostat Scenario impact CAPREGRegional dataInput allocation CAPMOD Exploitation Maps Tables Connection between CAPRI tools Data Base Tools
Data base tools • Build up a “suitable” data base for the model: • Comprising all the necessary input data • Using established and harmonized data sources • Without any gaps or inconsistencies • Main elements: • At Member State and regional level: • Cropping areas, herd sizes and production • Input and output coefficients • Farm policy instruments (quotas/set-aside/premiums) • Income indicators per activity and region • Farm and market balances, Economic Accounts for Agriculture and related prices at Member State level • World wide for individual countries or country aggregates: market balances, tariffs, preferential trade agreements, bi-lateral trade flows
Data base tools • Three “applications” • COCO: Member State level • CAPREG: regional level, input distribution • Global: market balances and trade flows, tariffs • Code is realized in GAMS • Application of Bayesian estimators to ensure completeness and consistency
National data base “CoCo” • Acronym means “Complete and Consistent” • Builds up time series from 1985-2005 (currently) for EU27, Norway and Western Balkans and Turkey for about 50 activities and products • Main input source is Eurostat(area statistics, farm and market balances, Economic Accounts for Agriculture, Agricultural prices ..) • Uses constrained estimation techniquesto remove data error and fill gaps • GAMS based • Handled by Bonn team
CoCo continued • Three “packages” inside CoCo: • Closed area balances, crop production = yields * area;for all crops simultaneously • Animal herds, slaughtered heads, live imports and exports, market balances for meat, balances for young animals, fat and protein balances for dairy products;simultaneously for groups of animals/animal products(cattle, pigs, poultry, sheep and goat, dairy products) • Market balances;simultaneously for groups of crops (cereals, oilseeds etc.)
Regional data “CAPREG” • Introduces input allocation and regional dimension • Takes data at Member State level(CoCo results) as fix and given • Main input sources: • REGIO domain from Eurostat • Data on CAP from DG-AGRI • Engineering functions, results from econometric estimation for input/feed/fertilizer allocation • Uses constrained estimation techniques to determine input allocation, fertilizer and feed distribution
REGIO Ensure that regional areas and herd sizematch given national ones CoCo results Distribute idling land, oilseeds to obl., vol. set-aside, fallow landand non-food production on set-aside Policy data Nutrient exportper crop Distribute inputs across activitiesat national level Engineering dataFADN estimates Ensure that regional yieldsmatch given national ones Adjust yield dependent inputsaccording to regional yields Manure outputfunctions Allocation of anorganic and organic fertilizeracross regions and crops Requirement functionsNutrient content Allocation of feeding stuffacross regions and animals Regional data “CAPREG”
Reference run • Two steps: • Trend estimates are integrated with external forecasts and consistency requirements (area and market balances …)(CAPTRD) • The supply model and the market model are calibrated ex-ante to these results(CAPMOD, baseline modus)
Scenario impact tool “CAPMOD” • Designed for counterfactual analysis: • what impacts if a different policy would be implemented? • Yard stick is the reference run, which covers • the current legislation • technical progress, population and income growth, changes in consumption patterns • for ~10 year horizon from the base year • CAPMOD combines supply models at NUTS II with an EU wide model for young animal and a global trade model for agricultural commodities
The supply side of CAPMOD • Each NUTS II region has its own model • Each model has the same structure (variables and equations), but differs in parameters from model for other regions • The models are aggregate non-linear programming model, i.e. they maximize an objective function (revenue – costs) under constraints (land balance, set-aside obligations etc.) • A non-linear cost function as part of the objective, partially based on econometric estimation, dampens over-specialization, allows for calibration to the base year situation and for model behavior based on observed developments
The supply side of CAPMOD cnt. • The constraints comprise: • Arable and grass land • Feed requirements (energy, protein, fibre, min/max of certain feedingstuff etc.)per animal type • N,P,K balances • Set-aside obligations • Milk quotas => Relatively small number of constraints !
The supply side of CAPMOD cnt. • The objective accounts for: • Revenues from selling products • Costs from buying variable inputs(fertilizer, plant protection, feed etc.) • Costs for other production factors(capital, labor, information) the non-linear part • A risk componentfor the A,B,C sugar-beet regime
Relations inside of supply model Purchasesof fertilizer Sales of animal outputs Sales or purchasesof young animals Animal activities Landbalances Nutrientbalances Young animal balances Set-aside Crop activities Feedbalances Requirementsbalances Salesof crop outputs Purchasesof feed
The global trade model of CAPMOD • Spatial Multi-Commodity Model • Comprises supply as well as feed, human consumption and processing demand for 47 products and 60 countries/country aggregates in 28 blocks • Includes bi-lateral trade flows, import tariffs (including Tariff Rate Quotas / preferential agreements) • And market interventions and export subsidies by the EU
The global trade model of CAPMOD • Armington approach: quality differences by origin of products => imperfect substitution between imports and domestic sales • “Well behaved” function synthetic parameters are in line with micro-economic theory consistent welfare analysis • Consumer prices are different from producer prices, in most cases fixed processing margin • Fat and protein balances for milk/dairy products for EU27 Member States
Link of modules in CAPRI AggregatedSupply &Feed demand ExploitationEnv. IndicatorsWelfare analysis FEOGA budget Market ModuleSpatialMulti-Commodity Model28 regional aggregatesplus all EU MS States Supply Module280 RegionalProgramming Models Premiums Prices Policy ModulesCAP Premiums(base areas, ...) Young Animal Market ModuleLinked MSProgramming Models HerdsAcreages Aggregation
WTO commitmentsCMO limits Price support(intervention sales, subsidised exports) Border protection(tariffs, TRQs) Sales Activity levels Set-aside obligations Sales quotas(milk, sugar beet) Compensation payments Premium ceilingsstockingdensities etc. Policy in the model Has animpact on Market prices for agricultural outputs
Spatial Downscaling • For environmental analysis, local factors as soil, slope, climate or surrounding land use matter • Spatial Downscaling part in CAPRI distributes consistently major results at regional level for EU27 to ~150.000 clusters of 1x1 km grid cells • Allows link to bio-physical models and specific analysis e.g. regarding landscape features
Exploitation tools • Java based Graphical User Interface (GUI): • Predefined views as tables, graphs or maps • Drill-down tables • User may additionally select or pivot • Results can be exported to clipboard and different file formats as CSV • Exploitation can be applied to data base or to scenario results • GUI covers also steering of the different work step including scenario runs
CAPRI network • CAPRI handled as “club good”: • Code handled as open source • but successful application of the model requires training and support • the resulting bottle-neck allows the core users/developers to control access • The core network has a informal agreement about distribution of tasks, tenders together for projects and exploits scientific findings in conference contributions and publications • Distribution and maintenance of code and data via a Software Version system to allow for distributed development and application