Download
1 / 26
260 likes | 394 Views
National Weather Service. 2010 Winter Outlook & ENSO update. Keith Stellman National Weather Service Shreveport, LA. “Oscillations”. ENSO (El Nino Southern Oscillation) The one you’ve all heard about El Nino, La Nina, and neither (Neutral). Normal Pacific Circulation. La Nina.

E N D
National Weather Service 2010 Winter Outlook & ENSO update Keith Stellman National Weather Service Shreveport, LA
“Oscillations” • ENSO (El Nino Southern Oscillation) • The one you’ve all heard about • El Nino, La Nina, and neither (Neutral) Normal Pacific Circulation La Nina El Nino
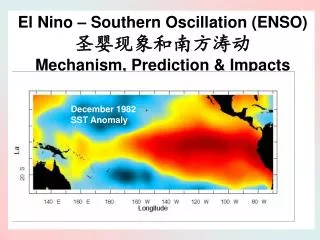
Pacific SST Departures (oC) La Niña Large positive anomalies associated with El Niño decreased beginning in late February 2010, becoming negative in late April. The large negative anomalies since June 2010 are consistent with the development and continuation of La Niña.
NOAA Operational Definitions for El Niño and La Niña El Niño:characterized by a SST anomalies greater than or equal to +0.5°C. La Niña:characterized by a SST anomalies less than or equal to -0.5°C. By historical standards, to be classified as a full-fledged El Niño or La Niña episode,these thresholds must be exceeded for a period of at least 5 consecutive overlapping 3-month seasons.
Niño Region SST Departures and Forecast (oC) The latest weekly SST departures are: Niño 4 -1.5ºC Niño 3.4 -1.5ºC Niño 3 -1.5ºC Niño 1+2 -0.6ºC Forecast
La Nina Forecast Hawaii Stg El Nino Neutral Stg La Nina
ENSO since 1950 The most recent ONI value (August – October 2010) is -1.3oC. ONI = Oceanic Nino Index El Niño neutral La Niña
Historical El Niño and La Niña Episodes Strongest El Nino 1957, 1966, 1972, 1983, 1987, 1991, 1998 Strongest La Nina 1951, 1955, 1973, 1989, 1999, 2007
ENSO (El Nino Southern Oscillation) • El Nino global effects During La Niña (cool phase of ENSO), the jet stream's position shows a large dip in the central and Eastern US. • La Nina global effects
Typical Patterns during La Niña Winters • Temperature • Precipitation • Jet Stream
La Nina years impacts La Nina years to compare 73-74 83-85 87-89 95-96 1998-2000 2007-2008
Local Winter Weather • Major ice eventsduring La Nina years include • February 1996 (moderate La Nina) – NE LA • 2 inches of Ice in NE LA • December 1999 (Moderate La Nina) NW LA/NE TX • December 2000 (moderate La Nina) – East TX/SW AR. Texarkana, TX Dec 2000 Hope, AR Dec 2000
1984-85 Summary 1973-74-75 Summary • November 24,1973 • East TX Tornado outbreak (F1-F2) • December 3, 1973 • Eastern LA Tornados (F2) • January 1-3,1974 • Temps < 32F with 1” of precip Recorded • January 19, 1974 • F3 tornado (deep E TX) • Tornadoes across east TX • March 20, 1974 • Several F3 Tornados (Lufkin->San Augustine-> Natchitoches LA) • Numerous injuries • March 28, 1974 • NE LA tornados • Numerous Hail/Wind reports through April • Snowstorm occurred in January 1975 • Feb 1-2,1985 • 4-6 inches of snow • April 5,1985 • NE LA Tornadoes • April 23,1985 • F3 tornadoes (NW LA) • Tornadoes across east TX
1988-1989 Weather Summary • Nov 19 and 25, 1988 – Severe Weather • Numerous Hail/Wind Reports • Several Tornadoes (Cass, Marion, Upshur, Angelina, Panola) • Feb 4-7,1989 • Temperatures < 30F with 0.20 inches of precipitation (not snow) • MLU reported ~0.5 inches of ice • April 3, 29 and May 5, 1989 • Severe Weather Days • Large Hail, Wind Damage • Tornadoes across NW LA (Caddo/Bossier)
1995-1996 Weather Summary • Feb 3, 1996 • 2 inches of Ice in NE LA • Jan 31-Feb 4, 1996 • Temperatures range from 14F-33F in SHV • 0.5 inches • Several Hail/Wind Events • April 20,22 (Baseball Hail) • East Texas -> NW LA -> NE LA • 80 mph wind in Monroe • Tornados in Madison Parish/Tyler area • No major tornado outbreaks
1998-1999 Weather Summary • December 22,1998 • Ice Storm across the Arklatex • Estimated $5-$6 Million in damages • January 1, 1999 • Tornado outbreak • F2 in Shreveport (10:26 PM), Doyline • F1 in Sligo • January 22, 1999 • Larger Severe Weather episode • Tornados and Hail along and south of I-20 • Feb 27, Mar 2, Mar 12
April – May 1999 • April 3, 1999 • Bossier City F4 Tornado • Benton • 7 Killed • Summerfield F3 Tornado • April 26, 1999 • 100 MPH wind at Shreveport • Numerous high wind reports across the area • May 4, 1999 • F2 in Plain Dealing (LA), Kilgore TX • F3 in Mt Vernon, Avery, Dekalb • Dekalb Elementary and High School hit Dekalb, TX Tornado
The 2000 Bug!! • April 23, 2000 • Largest tornado outbreak in the Arklatex History • 28 tornadoes ranging from F1-F3 • December 2000 • 2 major Ice Storms • Dec 12 and 23 • Estimated $500-$700 million in damages • 1 major snowfall • New Years Eve • 4-6 inches of snow fell Tornado Tracks, Easter 2000 Independence Bowl - 2000
2008 Leary • Feb-March • Arp, Hooks, Longview Tornadoes • Lindale/Bullard Hailstorms • Texarkana Hailstorm • April-May • Shreveport Floods • New rainfall records (14 inches) • San Augustine Flood • 20 inches in 24 hours • Leary, Henderson Tornados • Texarkana and Winnsboro downbursts Texarkana San Augustine
El Nino vs La Nina • Winter/Spring Tornadoes • Increased number during La Nina (right) when compared to El Nino El Nino Tornado tracks “…The Ohio River Valley and Deep South see a region of statistically significant increased tornadic activity during La Niña.” La Nina Tornado tracks • http://www.coaps.fsu.edu/papers/impacts_enso_tornadic_activity/ • http://www.spc.noaa.gov/publications/cook/ensowntr.pdf
Cool Season Outlook - Summary • Fall Severe Weather Season – Below Normal season most likely outcome • Winter Season Precip - more likely to see near to below normalprecipitation • Winter Season Temperatures – Above normaltemperatures most likely outcome • Winter Severe Weather – Near to Above normal season most likely outcome with at least 1 large event • Winter Weather • Snowfall at a near normal risk • Ice events - above normal risk • Spring Severe Weather – Above Normal Season
Consecutive Days Tmax < 35F - SHV • # Days End Date • 7 12/26/1983 • 5 1/22/1978 • 4 2/ 4/1996 • 4 12/19/1989 • 4 1/14/1982 • 4 1/14/1978 • 4 1/11/1973 • 4 1/28/1961 • 4 2/ 2/1951 • 3 1/ 2/2001 • 3 1/29/2000 • 3 1/13/1997 • 3 2/ 6/1989 • 3 1/ 8/1988 • 3 2/ 3/1985 • 3 1/ 4/1974 • 3 1/ 9/1968 • 3 12/23/1963 La Nina Neutral El Nino
Heating Degree Days – (Nov-Mar) • Marshall, TX • Average is 447 from 1972-2010 • 1973-74: 395 • 1984-85: 490 • 1988-89: 381 • 1995-96: 474 • 1998-99: 368 • 1999-2000: 338 • 2007-08: 348 • Shreveport, LA • Average is 406 from 1972-2010 • 1973-74: 358 • 1984-85: 389 • 1988-89: 390 • 1995-96: 431 • 1998-99: 330 • 1999-2000: 305 • 2007-08: 365 *Red indicates fewer heating degrees were needed which means warmer than normal
THANK YOU!!! Keith Stellman NWS Shreveport 5655 Hollywood Ave. Shreveport, LA 71109 www.srh.noaa.gov/shv/briefing keith.stellman@noaa.gov Paducah, KY Ice storm – January 2009 Radar image on April 23, 2000 – Centered on Shreveport