Download
1 / 12
120 likes | 289 Views
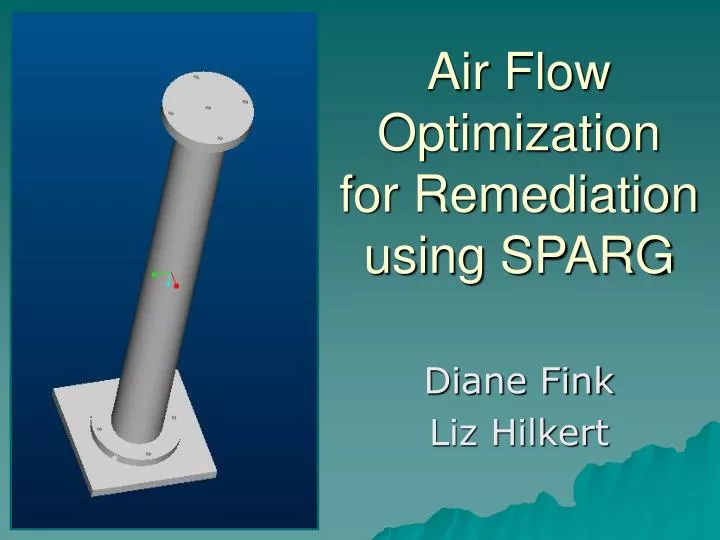
Air Flow Optimization for Remediation using SPARG. Diane Fink Liz Hilkert. Significance and Objective. Optimal airflow rates are important in remediation Ensure maximum contaminant volatilization Prevent channeling Determine ideal capillary pressures for a one meter soil column

E N D
Air Flow Optimization for Remediation using SPARG Diane Fink Liz Hilkert
Significance and Objective • Optimal airflow rates are important in remediation • Ensure maximum contaminant volatilization • Prevent channeling • Determine ideal capillary pressuresfor a one meter soil column • varying water table heights
SPARG Information • Unix based program for one or two dimensional column simulations • Uses finite element-Galerkin's formulation • The airflow simulation model that is the basis for AirFix • Includes contaminant transport
SPARG Calibration • Only dependable data from 2D model • Capillary Head of 10.15 m • Calibration successful
Constant Inputs: Psubd: 0.2 m Soil Lambda: 3.4 Porosity: 0.39 Grid: 1,10 Grid Division: 0.1 m Atmospheric Pressure: 10 m SPARG Inputs 20 elements 22 nodes
Varied SPARG Inputs • Water Table Height: • Half of Sand Height: 0.33 m • Full Sand Height: 0.67 m • Airflow Entry Rate (nodes 1 and 2): • Varied by increasing air entry pressure • Minimum for half full: 10.53 m • Minimum for full: 10.87 m
Effect of Air Entry Pressure at Full Water Table Height (0.67 m) Capillary Pressure Saturation
Effect of Air Entry Pressure at Half Water Table Height (0.33 m) Capillary Pressure Saturation
Capillary pressure: linear relationship with column height indirectly proportional to water table height directly proportional to air entry pressure at lower water table heights pressures converge as air reaches the top of the column, which is atmospheric Saturation: nonlinear relationship with column height directly proportional to water table height indirectly proportional to air entry pressure at lower water table heights saturation levels converge as air reaches the top of the column, which is atmospheric Graphical Trends
Conclusions • Full Water Table Height (0.67 m): • Air entry pressure range: 10.871 – 10.89 m • Half Water Table Height (0.33 m): • Air entry pressure range: 10.531 – 10.55 m
Thank You Questions?