Download
1 / 1
10 likes | 134 Views
Solid State Amorphization on the Properties of Materials. Michael Wei, Ke Han, Jun Lu, Robert Goddard National High Magnetic Field Laboratory, Tallahassee, FL 32310. INTRODUCTION:

E N D
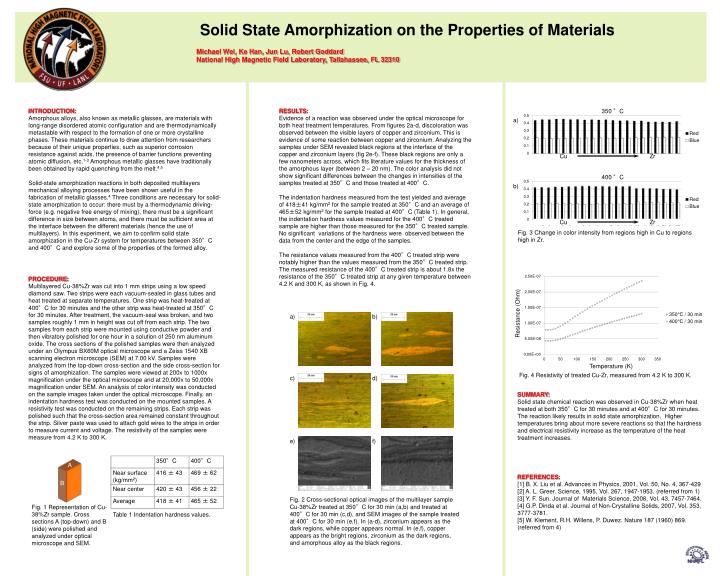
Solid State Amorphization on the Properties of Materials Michael Wei, Ke Han, Jun Lu, Robert Goddard National High Magnetic Field Laboratory, Tallahassee, FL 32310 INTRODUCTION: Amorphous alloys, also known as metallic glasses, are materials with long-range disordered atomic configuration and are thermodynamically metastable with respect to the formation of one or more crystalline phases. These materials continue to draw attention from researchers because of their unique properties, such as superior corrosion resistance against acids, the presence of barrier functions preventing atomic diffusion, etc.1-3 Amorphous metallic glasses have traditionally been obtained by rapid quenching from the melt.4,5 Solid-state amorphization reactions in both deposited multilayers mechanical alloying processes have been shown useful in the fabrication of metallic glasses.4 Three conditions are necessary for solid-state amorphization to occur: there must by a thermodynamic driving-force (e.g. negative free energy of mixing), there must be a significant difference in size between atoms, and there must be sufficient area at the interface between the different materials (hence the use of multilayers). In this experiment, we aim to confirm solid state amorphization in the Cu-Zr system for temperatures between 350°C and 400°C and explore some of the properties of the formed alloy. RESULTS: Evidence of a reaction was observed under the optical microscope for both heat treatment temperatures. From figures 2a-d, discoloration was observed between the visible layers of copper and zirconium. This is evidence of some reaction between copper and zirconium. Analyzing the samples under SEM revealed black regions at the interface of the copper and zirconium layers (fig 2e-f). These black regions are only a few nanometers across, which fits literature values for the thickness of the amorphous layer (between 2 – 20 nm). The color analysis did not show significant differences between the changes in intensities of the samples treated at 350°C and those treated at 400°C. The indentation hardness measured from the test yielded and average of 418±41 kg/mm2 for the sample treated at 350°C and an average of 465±52 kg/mm2 for the sample treated at 400°C (Table 1). In general, the indentation hardness values measured for the 400°C treated sample are higher than those measured for the 350°C treated sample. No significant variations of the hardness were observed between the data from the center and the edge of the samples. The resistance values measured from the 400°C treated strip were notably higher than the values measured from the 350°C treated strip. The measured resistance of the 400°C treated strip is about 1.8x the resistance of the 350°C treated strip at any given temperature between 4.2 K and 300 K, as shown in Fig. 4. a) Cu Zr b) Cu Zr Fig. 3 Change in color intensity from regions high in Cu to regions high in Zr. a) b) PROCEDURE: Multilayered Cu-38%Zr was cut into 1 mm strips using a low speed diamond saw. Two strips were each vacuum-sealed in glass tubes and heat treated at separate temperatures. One strip was heat-treated at 400°C for 30 minutes and the other strip was heat-treated at 350°C for 30 minutes. After treatment, the vacuum-seal was broken, and two samples roughly 1 mm in height was cut off from each strip. The two samples from each strip were mounted using conductive powder and then vibratory polished for one hour in a solution of 250 nm aluminum oxide. The cross sections of the polished samples were then analyzed under an Olympus BX60M optical microscope and a Zeiss 1540 XB scanning electron microscope (SEM) at 7.00 kV. Samples were analyzed from the top-down cross-section and the side cross-section for signs of amorphization. The samples were viewed at 200x to 1000x magnification under the optical microscope and at 20,000x to 50,000x magnification under SEM. An analysis of color intensity was conducted on the sample images taken under the optical microscope. Finally, an indentation hardness test was conducted on the mounted samples. A resistivity test was conducted on the remaining strips. Each strip was polished such that the cross-section area remained constant throughout the strip. Silver paste was used to attach gold wires to the strips in order to measure current and voltage. The resistivity of the samples were measure from 4.2 K to 300 K. 350 °C Resistance (Ohm) c) d) Temperature (K) Fig. 4 Resistivity of treated Cu-Zr, measured from 4.2 K to 300 K. SUMMARY: Solid state chemical reaction was observed in Cu-38%Zr when heat treated at both 350°C for 30 minutes and at 400°C for 30 minutes. The reaction likely results in solid state amorphization. Higher temperatures bring about more severe reactions so that the hardness and electrical resistivity increase as the temperature of the heat treatment increases. e) f) 400 °C Fig. 2 Cross-sectional optical images of the multilayer sample Cu-38%Zr treated at 350°C for 30 min (a,b) and treated at 400°C for 30 min (c,d), and SEM images of the sample treated at 400°C for 30 min (e,f). In (a-d), zirconium appears as the dark regions, while copper appears normal. In (e,f), copper appears as the bright regions, zirconium as the dark regions, and amorphous alloy as the black regions. A REFERENCES: [1] B. X. Liu et al. Advances in Physics, 2001, Vol. 50, No. 4, 367-429 [2] A. L. Greer. Science, 1995, Vol. 267, 1947-1953. (referred from 1) [3] Y. F. Sun. Journal of Materials Science, 2008, Vol. 43, 7457-7464. [4] G.P. Dinda et al. Journal of Non-Crystalline Solids, 2007, Vol. 353, 3777-3781. [5] W. Klement, R.H. Willens, P. Duwez. Nature 187 (1960) 869. (referred from 4) B Fig. 1 Representation of Cu-38%Zr sample. Cross sections A (top-down) and B (side) were polished and analyzed under optical microscope and SEM. Table 1 Indentation hardness values.