Download
1 / 29
290 likes | 347 Views
How do Replication and Transcription Change Genomes?. Andrey Grigoriev Director, Center for Computational and Integrative Biology Rutgers University. What are we going to do?. Observe effects of fundamental processes Estimate their relative contribution Link them to genome features

E N D
How do Replication and Transcription Change Genomes? Andrey Grigoriev Director, Center for Computational and Integrative Biology Rutgers University
What are we going to do? • Observe effects of fundamental processes • Estimate their relative contribution • Link them to genome features • Analyze nucleotide composition
How do Replication and Transcription Change Genomes? Well, do they?
Replication and Transcription • textbook view faithful reproduction machinery • basis for selection parental DNA fitness advantages
Replication and Transcription • paradox both systematically change genomes which they faithfully reproduce • and they leave traces
What is in the sequence? • The usual • coding, regulatory regions, exons, introns, RNAs, etc. • Biases in nucleotide composition • Traces of organism‘s „lifestyle“ • Links to genome features
Counting nucleotides: GC Skew sw = ([G]-[C])/([G]+[C]) • Short sequence interval (window) w • Relative excess of G vs C [-1;1] • Plot vs % of genome position [0;100]
Simian virus 40 Haemophilis influenzae position, % genome length
Cumulative Skew Diagrams sw = ([G]-[C])/([G]+[C]) S = W sw w/L For W adjacent windows of size w << L S is an integral of skew function
Simian virus 40 replication origin (ori) replication terminus (ter)
Haemophilis influenzae replication origin (ori) replication terminus (ter)
Genome of Escherichia coli Terminus Origin position, % genome length
Genome of Borellia burgdorferi position, % genome length
Cumulative Skew Diagrams • Now widely used to predict ori and ter in novel and less studied microbial genomes • Predictions confirmed experimentally • Constant skews over half-genomes • oriter G>CteroriG<C • Strand properties change at ori and ter
Causes: Selection vs. Mutation • Properties of encoded proteins • Regulatory sequences • Most pronounced in 3rd codon position • Suggests mutation, not selection pressure
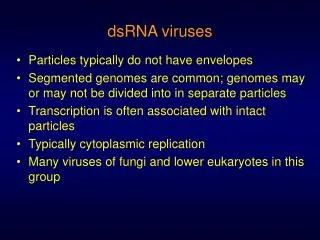
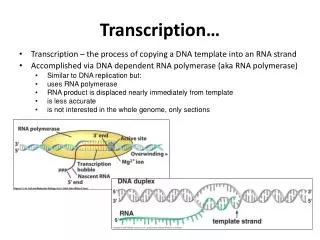
Transcription Replication template DNA continuous DNA synthesis mRNA synthesis discontinuous DNA synthesis DNA single-stranded, not protected
Most Consistent Explanation • spontaneous deamination of C or 5-MetC • by far the most frequent mutation (rates raise over 100-fold when DNA is single-stranded) • fixing the mutated base during the next round of replication • depletion of cytosines vs guanines
Cytosine Deamination Uracil Cytosine Thymine
Replication • Leading strand exposed in replication bubble, generation after generation • Unusual replication models consistent with the single-strand hypothesis • adenovirus • mitochondria
Adenovirus Replication origins position, % genome length
Replication or Transcription • Leading-lagging switch at ori and ter • Consistent with replication models • Transcription often colinear with replication • Direction often changes at ori and ter
Replication vs. Transcription • Comparable contribution to skew • [G]=900, [C]=690 in the same direction additive effect on skew • [G]=758, [C]=773 in the opposite direction cancel each other out
Diagrams „jagged“ • Sequence constraints • amino acid composition, regulatory sequences, etc. • Sequence inversions • swaps strands and change the skew to its opposite between the borders of the inversion • Horizontal transfer between species
Inversion 5‘ 3‘ 5‘ 3‘ A B C D A C B D
Rearrangements in two sequenced strains of Helicobacter pylori Colored areas under the curve correspond to inversions and translocations cagPAI – pathogenicity island (likely horizontal transfer)
Conclusions • Analyze nucleotide composition • Observe effects of fundamental processes • Link them to genome features • Estimate their relative contribution • Start asking own questions