Download
1 / 38
380 likes | 573 Views
Table of Contents. Access Prior Knowledge. New Information. Set Goals. Activity. Conclusion. What Do You Know About…?. “ The Market ” Learning Targets. Market Graph Puzzle. “ The Market ” Learning Targets. Two Types Of Goods. Related Goods. Economic Time Frames. Identifying

E N D
Table of Contents Access Prior Knowledge New Information Set Goals Activity Conclusion What Do You Know About…? “The Market” Learning Targets Market Graph Puzzle “The Market” Learning Targets Two Types Of Goods Related Goods Economic Time Frames Identifying Markets A Market Graph Creating a Graph
What Do You Know About…? Write down words that come to mind when you think of each of the following. There are no right or wrong answers!
Market 1) Supply Demand 2) Equilibrium / Equal 3) Shortage Surplus 4) Elastic Inelastic 5) What Do You Know About…? Write down words that come to mind when you think of each of the following. There are no right or wrong answers! Need help thinking of ideas?
Market 1) Supply Demand 2) Equilibrium / Equal 3) Shortage Surplus 4) Elastic Inelastic 5) What Do You Know About…? Write down words that come to mind when you think of each of the following. There are no right or wrong answers! Ask yourself these questions: 1) WHAT does this mean? 2) HOW does this happen? 3) WHY does this happen?
“The Market” Learning Targets Knowledge Understand the definitions for the different types of goods and services. Skill Translate price and quantity data into supply and demand graphs.
Two Types of Goods Goods (and services) fall into one of two categories. 1) Normal Goods 2) Inferior Goods
Two Types of Goods Goods (and services) fall into one of two categories. 1) Normal Goods 2) Inferior Goods Definition Items that people tend to buy more of when their incomes increase. This is true of most goods and services. See Examples
Two Types of Goods Goods (and services) fall into one of two categories. 1) Normal Goods 2) Inferior Goods Definition Items that people tend to buy more of when their incomes increase. This is true of most goods and services. Examples What examples can you think of? A) New Cars B) Coca-Cola or Pepsi C) Televisions D) Clothes
Two Types of Goods Goods (and services) fall into one of two categories. 1) Normal Goods 2) Inferior Goods Definition Items that people purchase more of when their incomes decrease. These items tend to be low-cost options for saving money. See Examples
Two Types of Goods Goods (and services) fall into one of two categories. 1) Normal Goods 2) Inferior Goods Definition Items that people purchase more of when their incomes decrease. These items tend to be low-cost options for saving money. Examples What examples can you think of? A) Ramen Noodles B) Frozen Dinners C) Bus Transportation D) Used Clothes
Related Goods Sometimes goods (or services) are related to each other in one of two special ways. 1) Substitute Goods 2) Complementary Goods
Related Goods Sometimes goods (or services) are related to each other in one of two special ways. 1) Substitute Goods 2) Complementary Goods Definition Items that may replace each other when used or consumed. See Examples
Related Goods Sometimes goods (or services) are related to each other in one of two special ways. 1) Substitute Goods 2) Complementary Goods Definition Items that may replace each other when used or consumed. Examples A) Butter . . . . . . . . . . Margarine B) McDonald’s . . . . . Burger King What examples can you think of?
Related Goods Sometimes goods (or services) are related to each other in one of two special ways. 1) Substitute Goods 2) Complementary Goods Definition Items that are almost always consumed or used together. See Examples
Related Goods Sometimes goods (or services) are related to each other in one of two special ways. 1) Substitute Goods 2) Complementary Goods Definition Items that are almost always consumed or used together. Examples A) Hot Dogs . . . . . Hot Dog Buns B) Toothbrush . . . . Toothpaste What examples can you think of?
Economic Time Frames There are two ambiguous time frames that economists use to analyze a market. 1) Short Run 2) Long Run
Economic Time Frames There are two ambiguous time frames that economists use to analyze a market. 1) Short Run 2) Long Run Definition An undefined period of time that is NOT long enough to allow consumers or producers enough time to adjust to all changes in an economic situation. See Example
Economic Time Frames There are two ambiguous time frames that economists use to analyze a market. 1) Short Run 2) Long Run Definition An undefined period of time that is NOT long enough to allow consumers or producers enough time to adjust to all changes in an economic situation. Example Suppose Coca-Cola Vanilla becomes extremely popular. Coca-Cola cannot increase its output immediately to accommodate demand because it takes time to adjust to the new demand.
Economic Time Frames There are two ambiguous time frames that economists use to analyze a market. 1) Short Run 2) Long Run Definition An undefined period of time that is long enough for people to adjust to all changes in an economic situation. See Example
Economic Time Frames There are two ambiguous time frames that economists use to analyze a market. 1) Short Run 2) Long Run Definition An undefined period of time that is long enough for people to adjust to all changes in an economic situation. Example On the other hand, Coca-Cola Vanilla can increase its production in the long run by opening new factories and by locating additional raw materials.
Identifying Markets When analyzing a market, it is always important to know which market you are talking about! Example 1 Example 2
Identifying Markets When analyzing a market, it is always important to know which market you are talking about! Example 1 Which market is this? ? Example 2
Identifying Markets When analyzing a market, it is always important to know which market you are talking about! Example 1 Oranges? Orange Juice? Navel Oranges? Which market is this? Example 2
Identifying Markets When analyzing a market, it is always important to know which market you are talking about! Example 1 Example 2 Which market is this? ?
Identifying Markets When analyzing a market, it is always important to know which market you are talking about! Example 1 Example 2 Shoes? Women’s Shoes? High Heels? Which market is this?
A Market Graph Each graph you draw will contain each of the following items.
A Market Graph Each graph you draw will contain each of the following items. 1) Title of the market Market for High Heels
A Market Graph Each graph you draw will contain each of the following items. 1) Title of the market Market for High Heels $70 $60 2) Price range on the vertical axis (y-axis) $50 $40 Price $30 $20 $10 $0
A Market Graph Each graph you draw will contain each of the following items. 1) Title of the market Market for High Heels $70 $60 2) Price range on the vertical axis (y-axis) $50 $40 Price $30 3) Quantity on the horizontal axis (x-axis) $20 $10 $0 0 25 50 75 100 125 150 175 Quantity
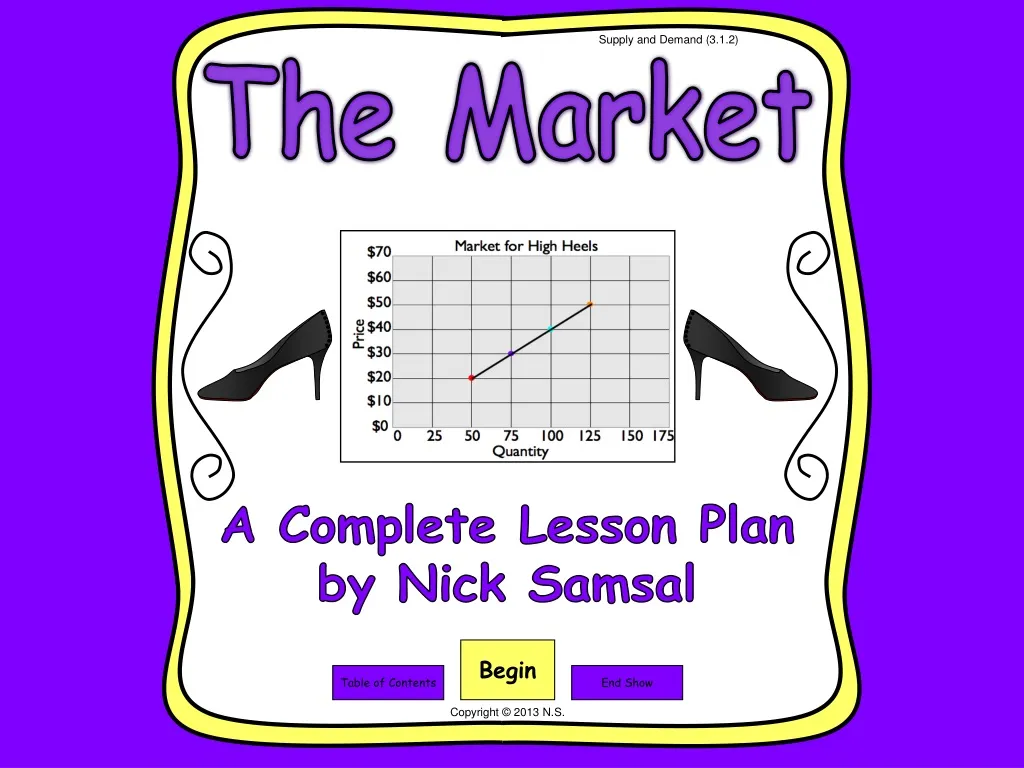
Creating a Graph This unit will require us to draw several market graphs. Follow these steps. Market for High Heels $70 $60 $50 $40 Price $30 $20 $10 $0 0 25 50 75 100 125 150 175 Quantity
Creating a Graph This unit will require us to draw several market graphs. Follow these steps. 1) Plot data points using provided information Market for High Heels $70 $60 $50 $40 Price See Data $30 $20 $10 $0 0 25 50 75 100 125 150 175 Quantity
Creating a Graph This unit will require us to draw several market graphs. Follow these steps. 1) Plot data points using provided information Market for High Heels $70 $60 $50 $40 Price $20 50 $30 $30 75 $20 $40 100 $10 $50 125 $0 0 25 50 75 100 125 150 175 Plot Data Quantity
Creating a Graph This unit will require us to draw several market graphs. Follow these steps. 1) Plot data points using provided information Market for High Heels $70 $60 $50 $40 Price $20 50 $30 $30 75 $20 $40 100 $10 $50 125 $0 0 25 50 75 100 125 150 175 Quantity
Creating a Graph This unit will require us to draw several market graphs. Follow these steps. 1) Plot data points using provided information Market for High Heels $70 $60 $50 $40 Price $20 50 $30 $30 75 $20 $40 100 $10 $50 125 $0 0 25 50 75 100 125 150 175 2) Connect data points with a line Quantity
Market Graph Puzzle DIRECTIONS 1) Cut this sheet in half on the dotted line. 2) Cut out the items from the bottom portion on the dotted lines. 3) Glue these items into the empty box on the top portion. Be sure to glue them in the proper locations for creating a market graph.
“The Market” Learning Targets Knowledge Understand the definitions for the different types of goods and services. Skill Translate price and quantity data into supply and demand graphs.