Download
1 / 26
260 likes | 344 Views
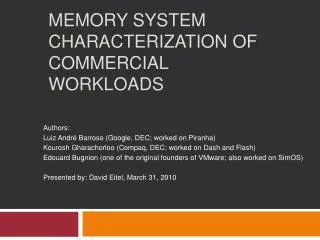
Lock Behaviour Characterization of Commercial Workloads. <chang@cs.wisc.edu> <wxd@cs.wisc.edu>. Jichuan Chang Xidong Wang. Outline. Motivation Methods Results Speculative Lock Elision Issues Conclusions. Motivation. Understanding the Synchronization Behavior of Commercial Workloads

E N D
Lock Behaviour Characterization of Commercial Workloads <chang@cs.wisc.edu> <wxd@cs.wisc.edu> Jichuan Chang Xidong Wang CS757
Outline • Motivation • Methods • Results • Speculative Lock Elision Issues • Conclusions CS757
Motivation Understanding the Synchronization Behavior of Commercial Workloads (OLTP, Apache, SpecJBB) Identifying Opportunities for Speculative Lock Elision (performance, ease of programming) CS757
Lock-free section Contention (spin/wait) Critical section time Questions to Answer • Lock related statistics • Can hardware identify critical sections? • Critical section size • Lock-free section size • Amount of lock contentions • Hardware optimizations by speculation • Context switching implications • Resource requirements • Other issues • Realistic timing model • Other synchronization (reader/writer, etc) CS757
Methods • Benchmarks • OLTP, Apache, JBB, Barnes (for comparison) • Full system simulation (tracing) using Simics • Simple timing model - Simics tracer • Ruby timing model - Simics + Ruby • Using #instr (not #cycle) as the measurement unit • Set cpu_switch_time to 1, disable STC • Validating our approach • Using micro-benchmarks, to compare our stats with the result reported by kernel tools (lockstat) • Tracing into disassembly code (kernel/user) CS757
Lock Identification • Basic idea [from SLE] • Lock acquisition must use one atomic instruction. • Silent store pair: as a pair, the stores in lock acquisition and release operations are silent. • SPARC v9 atomic instructions • ldstub, swap, casa (compare-and-swap) OLTP Values JBB Values ldstub [%o0 + %g0], %o4 brnz,pn %o4, <0x10034b98> stbar … … stb %g0, [%o0 + 12] 0x0->0xff … … 0xff->0x0 casa [%l2] 128,%g4,%g3 … … … casa [%l2] 128,%l0,%g4 0x1->0x8410f8bc … … … 0x8410f8bc->0x1 CS757
Lock Identification Algorithm • Starts with an atomic instruction • that writes back a different value to the lock • otherwise meaning unsuccessful lock acquisition • Examine each following store made by the same CPU • Until we meet a normal store • that completes the silent store pair • usually with the value of 0x0 • Other completion patterns • Self-release (by the same CPU) • using atomic instruction, pair-silently (JBB) • using atomic instruction, not pair-silently • Cross-release (by a different CPU) • using atomic instruction; • Removed: can’t observe lock release (16K limited window). CS757
Lock Frequency CS757
Critical Section Size CS757
Lock-free Section Size CS757
Simple Timing Ruby Timing Timing Models • Adding Ruby doesn’t change the size of critical section and lock-free section, but removes lock contentions. • Why? • “Shrinking” caused by less frequent memory accesses within critical sections • or simulation effect? • Guess: more shrinking using Ruby and Opal CS757
46% 236% 70% Lock Contention • Waiting: from the first try to successful acquisition • Spinning: ignore those have been waiting for more than 4K instructions. CS757
Distinguishing “wait” and “spin” • Why bother? • Very few long-waiting events make big difference in the percentages of wasted instructions • Easy if we can identify thread switching • But the identification is not easy • Waiting if spinning for too many instructions • Using 4096 instructions as the limit • 90+% contentions are shorter than 4K instr • It makes sense for different timing models. CS757
SLE on Commercial Workloads • Context switching (later) • Buffering requirement – Not much • Small critical sections dominate • Except for Apache user locks (1-8K) • Single shared buffer among threads on the same CPU • Possible performance gain • Not big if only counting num of instructions (1 - 6%) • Critical section size already small • Contention already infrequent • Can be larger if lock spinning latency increases • Can be smaller • less lock contentions happen (as in Ruby case) • Must throttle speculation (to avoid unnecessary rollbacks) CS757
Context Switch • Why bother? • Needed to precisely quantify the amount of instructions spent on lock waiting (process and thread switching) • Needed to correctly implement speculative lock elision (process switching only) • Process Switching Identification • Marker: Demap TLB on context switch • Apache (100 transactions, CPU #3) • Average: ~210K instructions (Max ~360K, Min ~160K) • Process switching are infrequent, performance implication negligible • Thread Switching Identification is hard • No simple patterns to observe, No feedback to validate assumptions • Not a good idea to provide separate buffer for each thread on a single processor. Hard to detect conflicts, thread switch & need many buffers. CS757
Other Synchronization Algorithms • Hard to recognize complex synchronization • Barriers, Read/writer locks, etc • Mutual Exclusion implementation composed of the small critical sections • pthread_mutex_lock(&lock) acquires 3 lock • Reader/writer lock use locks to maintain data structure (reader/writer queues, num of current reader, etc) Serialized Execution (maintained by synch. algo.) writer_enter() writer_exit() HW only sees two small critical sections CS757
Conclusion • Commercial workloads lock characterization • Small critical sections dominate • Infrequent lock contention • User/kernel code have different behavior • Kernel locks can’t be ignored • (Kernel) contented PCs predictable • Performance Improvements • SLE won’t help as much CS757
Thank You! Questions? CS757
Backup Slides • Thread switching details • Critical section size using Ruby timing model • Sparc Atomic Instructions • Misc Issues • Acknowledgement CS757
Thread Switch Identification • User thread scheduling • Disassemble user thread library, Observe execution of scheduling methods (_disp, _switch). not always possible!! • Kernel thread scheduling • Involve a set of interleaved method invocations (resume, disp, swtch, _resume_from_idle..). Hard to identify starting and ending point of thread switch • Impossible to identify kernel thread switch by only observing register window swap since it also happen in user thread switch • No feedback from OS to validate our assumption • Methodology & Preliminary Observations • Disassemble kernel code to build VA kernel method map. Observe the method control flow in Simics trace. • resume may indicate a kernel thread switch • user_rtt may indicate a user level thread switch. • Conclusion: Thread Switch Identification is a hard, unresolved issue CS757
Sparc Atomic Instructions • ldstub • Write all 1 into a byte • Swap • Swap the value of the reg and the mem location • Compare-and-swap • Swap if (value in the 1st reg == value in mem) • Membar/stbar • Usually follows such atomic instructions CS757
Misc. • Why Apache “strange”? • Lock more frequent, few user lock (1-2%) • Large percentage of critical section instruction • Nested Locks • Intertwined Locks • Critical sections in Barnes are more clustered • Buffer size ≤ 2^9 * 30% * 1/3 = 64 Blocks • The same as SLE CS757
Acknowledgement • Project suggested by Prof. Mark Hill • Guiding and supporting • Lots of discussion with and help from • Min Xu, our TA • Carl Mauer, Multifacet simulator expert • Ravi Rajwar, SLE paper author CS757