Download
1 / 44
470 likes | 704 Views
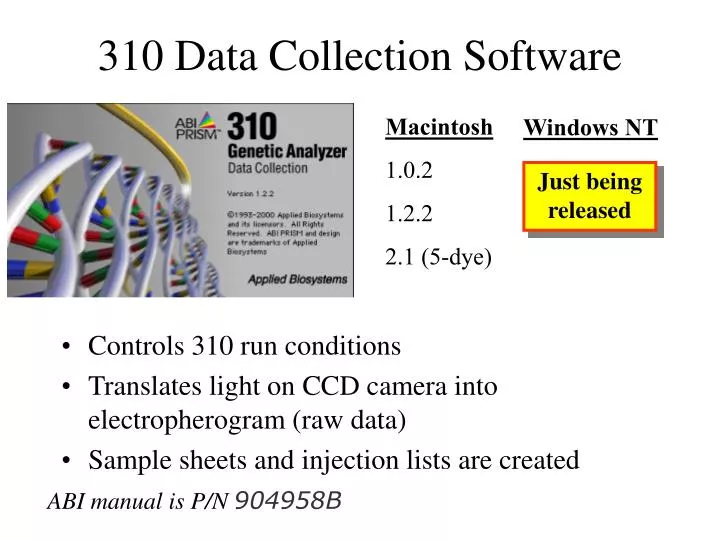
310 Data Collection Software. Macintosh 1.0.2 1.2.2 2.1 (5-dye). Windows NT. Controls 310 run conditions Translates light on CCD camera into electropherogram (raw data) Sample sheets and injection lists are created. Just being released. ABI manual is P/N 904958B .

E N D
310 Data Collection Software Macintosh 1.0.2 1.2.2 2.1 (5-dye) Windows NT • Controls 310 run conditions • Translates light on CCD camera into electropherogram (raw data) • Sample sheets and injection lists are created Just being released ABI manual is P/N 904958B
Injection List in Data Collection Software • Lists samples to be analyzed (repeats can be easily performed) • Sets virtual filter on CCD camera • Sets electrophoresis time and voltage • Sets injection time and voltage • Sets run temperature • If desired, sample analysis can be set up for automatic matrix color separation and sizing with internal standards using defined analysis parameters
Steps Performed in Standard Module • Capillary fill – polymer solution is forced into the capillary by applying a force to the syringe • Pre-electrophoresis – the separation voltage is raised to 10,000 volts and run for 5 minutes; • Water wash of capillary – capillary is dipped several times in deionized water to remove buffer salts that would interfere with the injection process • Sample injection – the autosampler moves to position A1 (or the next sample in the sample set) and is moved up onto the capillary to perform the injection; a voltage is applied to the sample and a few nanoliters of sample are pulled onto the end of the capillary; the default injection is 15 kV (kilovolts) for 5 seconds • Water wash of capillary – capillary is dipped several times in waste water to remove any contaminating solution adhering to the outside of the capillary • Water dip – capillary is dipped in clean water (position 2) several times • Electrophoresis – autosampler moves to inlet buffer vial (position 1) and separation voltage is applied across the capillary; the injected DNA molecules begin separating through the POP-4 polymer solution • Detection – data collection begins; raw data is collected with no spectral deconvolution of the different dye colors; the matrix is applied during Genescan analysis
Raw Data from the ABI Prism 310 (prior to separation of fluorescent dye colors)
GeneScan® Software Macintosh 2.1 3.1 3.1.2 (5-dye) Windows NT 3.7 (5-dye) • Calls peaks (based on threshold values) • Separates colors with matrix file • Sizes peaks with internal size standard ABI manual is P/N 4303189
Screens in GeneScan® Program • Processed data • Sizing data • Electrophoresis history • Sample Information • Raw data • Analysis log file Each screen can be used to aid in evaluation of samples and trouble shooting problem samples during data analysis
Matrix Standards (Raw Data) 6FAM TET HEX ROX
DNA Size Data Point DNA fragment peaks in sample Process of Sizing DNA Fragments Using an Internal Standard 250 200 165.05 bp 160 150 DNA fragment peaks are sized based on the sizing curve produced from the points on the internal size standard 147.32 bp 139 100
X1 + X2 X1 X2 Size of STR Allele = 2 Sizing Algorithm • Local Southern is commonly used but may not be the best in all situations • Local Southern involves using 2 peak above and 2 peaks below an unknown peak from the internal size standard to make a calculated DNA size STR Allele Internal size standard
Internal Sizing Standards GS500 ROX (Applied Biosystems) ILS600 CXR (Promega) LTI 50-500 ROX (Life Technologies)
Thoughts on Size Standards • Be consistent in use if you want to be able to compare data over time • All size standards I have tested work • Allele sizes are different with different internal sizing standards • GS500 has a large “hole” in its sizing ability when using the local Southern algorithm for medium-sized STR alleles because of the 250 bp peak that cannot be used; also must be run out to 450 bp to be able to type large FGA alleles with ABI kits
Genotyper Software Macintosh 2.0 2.5 2.5.2 (5-dye) Windows NT 3.7 (5-dye) • Converts GeneScan sized peaks into genotype calls using macros • Genotyping performed by comparison of allele sizes in allelic ladder to sample alleles ABI manual is P/N 904648
Profiler Plus Allelic Ladders VWA D3S1358 FGA AMEL D8S1179 D21S11 D18S51 D13S317 D5S818 D7S820
COfiler Allelic Ladders D3S1358 D16S539 AMEL TH01 TPOX CSF1PO D7S820
SGM Plus Allelic Ladders VWA D2S1338 D3S1358 D16S539 AMEL D21S11 D8S1179 D18S51 FGA D19S433 TH01
Identifiler Allelic Ladders D8S1179 D7S820 CSF1PO D21S11 D2S1338 D3S1358 TH01 D13S317 D16S539 D19S433 VWA TPOX D18S51 FGA AMEL D5S818
PowerPlex® 16 Ladders Penta E D18S51 D3S1358 TH01 D21S11 Penta D D16S539 CSF1PO D13S317 D7S820 D5S818 FGA D8S1179 VWA AMEL TPOX
Data Collection Peak Identification Color Separation Peak Sizing Comparison to Allelic Ladder Genotype Assignment to Alleles Data Review by Analyst/Examiner Confirmation of Results by Second Analyst/Examiner Steps in STR Genotyping Process Data Collection software GeneScan software Matrix file Internal sizing standard (e.g., GS500-ROX) Allelic ladder sample Genotyper software Expert Systems under Development (e.g., True Allele)
Three Possible Outcomes • Match – Peaks between the compared STR profiles have the same genotypes and no unexplainable differences exist between the samples. Statistical evaluation of the significance of the match is usually reported with the match report. • Exclusion – The genotype comparison shows profile differences that can only be explained by the two samples originating from different sources. • Inconclusive – The data does not support a conclusion as to whether the profiles match. This finding might be reported if two analysts remain in disagreement after review and discussion of the data and it is felt that insufficient information exists to support any conclusion.
Increasing Sample Throughput with Parallel Processing ABI 3100 16-capillary array ABI 310 single capillary Subtle differences in matrix formation and sizing algorithms – NOT directly equivalent to 310
Chapter 6 covers these topics in detail Biological “Artifacts” of STR Markers • Stutter Products • Non-template nucleotide addition • Microvariants • Null alleles • Mutations
Stutter Products • Peaks that show up primarily one repeat less than the true allele as a result of strand slippage during DNA synthesis • Stutter is less pronounced with larger repeat unit sizes (dinucleotides > tri- > tetra- > penta-) • Longer repeat regions generate more stutter • Each successive stutter product is less intense (allele > repeat-1 > repeat-2) • Stutter peaks make mixture analysis more difficult
6.3% 6.2% 5.4% STR Alleles with Stutter Products DNA Size (bp) D8S1179 D18S51 D21S11 Allele Relative Fluorescence Units Stutter Product
1 2 3 4 5 6 4 5 1 2 3 Repeat unit bulges out when strand breathing occurs Schematic of Stutter Product Formation Process Normal STR Allele Replication Slipped Strand Mispairing Model Walsh et al (1996) Nucleic Acids Res. 24: 2807-2812
A A Non-template Addition • Taq polymerase will often add an extra nucleotide to the end of a PCR product; most often an “A” • Dependent on 5’-end of the reverse primer • Can be enhanced with extension soak at the end of the PCR cycle (e.g., 15-45 min @ 60 or 72 oC) • Can be reduced with new polymerase • Best if there is NOT a mixture of “+/- A” peaks
Impact of the 5’ nucleotide on Non-Template Addition +A +A 5’-ACAAG… Last Base for Primer Opposite Dye Label +A +A -A -A 5’-CCAAG…
Null Alleles • Allele is present in the DNA sample but fails to be amplified due to a nucleotide change in a primer binding site • Allele dropout is a problem because a heterozygous sample appears falsely as a homozygote • Two PCR primer sets can yield different results on samples originating from the same source • This phenomenon impacts DNA databases • Large concordance studies are typically performed prior to use of new STR kits
Heterozygous alleles are well balanced 6 8 Imbalance in allele peak heights 6 8 * 8 * Allele 6 amplicon has “dropped out” Impact of DNA Sequence Variation in the PCR Primer Binding Site No mutation Mutation in middle of primer binding site Mutation at 3’-end of primer binding site (allele dropout)
Apparent Null Alleles Observed During Concordance Studies 7/13 CODIS loci affected so far
Microvariants • Defined as alleles that are not exact multiples of the basic repeat motif or sequence variants of the repeat motif or both • May exist as insertion, deletion, or base change • Sequence variation can occur within repeat, in the flanking region, or in a primer binding site • Can cause PCR failure due to polymorphism in the primer site -- “null alleles”
28.1 Detection of a Microvariant Allele at the STR locus FGA 1 = S25-L25 = 244.34 - 244.46 = -0.12 bp 2 = SOL - L28 = 257.51-256.64 = +0.87 bp c = |1 -2| = |-0.12-0.87| = 0.99 bp
Caution with Sizing Extreme “Off-Ladder” Alleles FGA ladder allele 30 Unknown FGA allele bp repeat 310 Data 264.79 330.60 65.81 16.45 (46.2) 264.96 330.63 65.67 16.42 (46.2) 264.66 330.50 65.84 16.46 (46.2) 377 Data 267.88 329.44 61.76 15.44 (45.2) 267.13 329.89 61.76 15.44 (45.2) 267.56 329.23 61.67 15.41 (45.2) Data courtesy of Melissa Fiebelkorn (Maine State Police Crime Lab)
Three-Peak Patterns D21S11 D18S51 “Type 1” “Type 2” Sum of heights of two of the peaks is equal to the third Balanced peak heights Most common in TPOX and D21S11 Most common in D18S51 and …..
STRBase http://www.cstl.nist.gov/biotech/strbase [GATA][GATA][GATA][-ATA][GATA] Database of Variant Alleles 150 New Variants 15 total D7S820 variants AND 33 unique 3-banded patterns Number of variants reported(as of Sept 2001) CSF1PO: 9 D3S1358: 13 D7S820: 15 D8S1179: 2 D13S317: 6 D16S539: 10 D18S51: 20 D21S11: 15 FGA: 45 TH01: 3 TPOX: 5 VWA: 4 D5S818: 3
14,18 15,17 14,18 15,17 15,18 13,17 Mutation Observed in Family Trio Normal Transmission of Alleles (No Mutation) Paternal Mutation
STR Locus Maternal Meioses (%) Paternal Meioses (%) Null Alleles (%) Multi-Banded (%) CSF1PO 14/47843 (0.03) 311/243124 (0.13) 2/42020 (<0.01) None reported FGA 7/8253 (0.01) 555/189973 (0.29) 2/1104 (0.18) None reported TH01 5/42100 (0.01) 12/74426 (0.02) 2/7983 (0.03) 0/2646 (<0.040) TPOX 2/28766 (0.01) 10/45374 (0.02) 11/43704 (0.03) 13/42020 (0.03) VWA 20/58839 (0.03) 851/250131 (0.34) 7/42220 (0.02) 1/6581 (0.02) D3S1358 0/4889 (<0.02) 9/8029(0.11) None reported None reported D5S818 22/60907 (0.04) 194/130833 (0.15) 3/74922 (<0.01) None reported D7S820 14/50827 (0.03) 193/131880 (0.15) 1/42020 (<0.01) 1/406 (0.25) D8S1179 5/6672 (0.07) 29/10952 (0.26) None reported None reported D13S317 33/59500 (0.06) 106/69598 (0.15) 52/62344 (0.08) None reported D16S539 12/42648 (0.03) 40/48760 (0.08) 3/52959 (<0.01) 0/1165 (<0.09) D18S51 8/8827 (0.09) 29/9567 (0.30) None reported None reported D21S11 12/6754 (0.18) 17/6980 (0.24) 1/203 (0.49) None reported Measured Mutation Rates http://www.cstl.nist.gov/biotech/strbase/mutation.htm *Data used with permission from American Association of Blood Banks (AABB) 1999 Annual Report.
Summary of STR Mutations • Mutations happen and need to be considered • Usually 1 in ~1000 meioses • Paternal normally higher than maternal • VWA, FGA, and D18S51 have highest levels • TH01, TPOX, and D16S539 have lowest levels
STRBase 1479 Short Tandem Repeat DNA Internet Database http://www.cstl.nist.gov/biotech/strbase • Forensic Interest Data • FBI CODIS Core Loci • DAB Standards • NIST SRM 2391 • Published PCR Primers • Y-Chromosome STRs • Population Data • Validation Studies • General Information • Intro to STRs (downloadable PowerPoint) • STR Fact Sheets • Sequence Information • Multiplex STR Kits • Variant Allele Reports • Supplemental Info • Reference List • Technology Review • Addresses for Scientists • Links to Other Web Sites
“Decay curve” of degraded DNA Degraded DNA Results AMEL 15 years old (room temp storage) D19 D3 TH01 VWA D8 D21 FGA D16 D18 D2 D3 AMEL 6 years old (-20 oC storage) D19 D21 D8 VWA TH01 D16 D18 D2 FGA Results with SGM Plus STR kit (Applied Biosystems)
Sample Mixture ExampleProfiler Plus data 4 peaks at a single locus Higher than expected stutter FGA D3S1358 VWA blue panel Amel green panel Relative Fluorescence Units D8S1179 D21S11 D18S51 “Stutter” on wrong side of allele Imbalance in X and Y peak ratios D13S317 yellow panel D5S818 D7S820