Download
1 / 9
100 likes | 244 Views
Aerosol Measurements (2010). Single particle mass spectrometry (ATOFMS) On-line size, chemical mixing state, optical properties (0.2 to 3 m m) Rapid analysis (up to 10 per second) of all chemical species Dust (1, 2, 3…) Sea salt Organic carbon Biomass burning Soot or “BC”

E N D
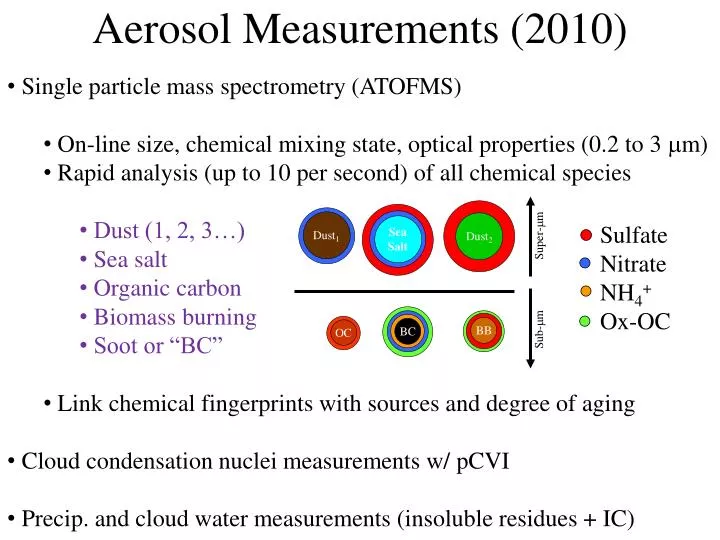
Aerosol Measurements (2010) • Single particle mass spectrometry (ATOFMS) • On-line size, chemical mixing state, optical properties (0.2 to 3 mm) • Rapid analysis (up to 10 per second) of all chemical species • Dust (1, 2, 3…) • Sea salt • Organic carbon • Biomass burning • Soot or “BC” • Link chemical fingerprints with sources and degree of aging • Cloud condensation nuclei measurements w/ pCVI • Precip. and cloud water measurements (insoluble residues + IC) Sulfate Nitrate NH4+ Ox-OC
Chemistry: Predicting climate impacts Assumptions: Bulk properties Mid-solubility Adsorbs slightly more water Scatters + absorbs light Reacts slightly faster Involved in ice nucleation Not representative of any atmospheric particle Real World Chemistry High solubility Adsorbs more water Scatters more light Reacts faster heterogeneously Forms CCN Low solubility Adsorbs less water Scatters less light Reacts slower heterogeneously Forms ice nuclei *Currently dust treated as single entity in models
Aerosol Time-of-Flight Mass Spectrometry (ATOFMS) Inlet Ellipsoidal Mirrors TSI 3800 Particle Inlet Scattering Lasers (532 nm) Particle Sizing PMT Reflectron + ions - ions Particle Chemistry Nd:YAG Laser (266 nm) Detectors • 1) Prather et al. Anal. Chem.1994 ; 2) Gard et al. Anal. Chem.1997 • 3) Su et al. Anal. Chem.2004; 4) Pratt et al. Anal. Chem.2009
Single Mineral Dust Particle 23Na Da = 2.02 m 27Al 39K 56Fe/56CaO 40Ca 18NH4 48Ti 7Li 64TiO 46NO2 42CNO 60SiO2/ 60CO3 77HSiO3 35Cl 16O 26CN 97HSO4 80SO3 62NO3
Biological Particle (RF01) • First on-line detection of biological particles in cloud ice crystals • Bacteria have been shown previously to be effective ice nuclei1 • Very similar single particle mass spectral signature to Pseudomonas syringae 1. Vali et al 1976. Pratt, et al. Nature Geoscience, 2009
CCNc-pCVI chemistry studies 1) CCNc 3) ATOFMS 2) pCVI Size select with CVI (separate >5 microns) Activate particles at set supersaturation (i.e. 0.1%) Chemically analyze particles that activate vs. those that do not • Which sources produce the most CCN active particles (marine, biomass • burning, ??) • Do particles with certain mineralogies activate better than others? • Does aging make particles more or less CCN active? • Collaboration with Dan Cziczo (PNNL) • Boulter et al. Aerosol Sci. Technol. 2006
Proposed Hypotheses • Cloud properties in the TMCF are different during intense LRTAD periods. • Identify fractional contribution of dust to total aerosol. • Compare to cloud property measurements. • (2) Long range transported AD (LRTAD) has unique chemical and physical properties which influence cloud properties and processes. • Use ATOFMS to distinguish between periods with AD vs. • local dust (or other) sources. • Measure CCN activity of atmospheric aerosols. • (3) Precipitation has a highly non-linear response to LRTAD. • Identify periods with high concentration of LRTAD • Compare to precipitation rate
Related questions • Identify major local aerosol sources in the region and how they vary • over time. • Measure size-resolved mixing state change for different periods of • influence. • local sources • fresh and aged marine • African dust • How do the CCN properties change for different influences? • How does the degree of aging impact the CCN activity of the • aerosols? • How do different aerosol sources impact the cloud relevant properties? • Drop size distribution • Rain rate
Timing • 3 weeks in July 2010 • 1 month in May 2011 (coordinate ground w/ ICE-T flights) • Additional measurements will be added in 2011 (w/ PNNL) • Hygroscopicity • Gas phase • Other?