Download
1 / 30
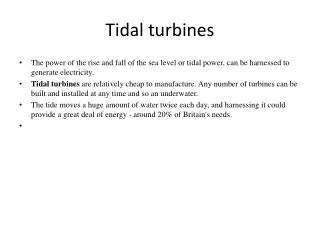
330 likes | 511 Views
TIDAL PHENOMENA . + hurricane water elevation profiles. tides and tidal phenomena are studied because :. safe coastal navigation requires knowledge of tide stage and flow Dispersion and aggregation of shore-line materials are affected by tides

E N D
TIDAL PHENOMENA + hurricane water elevation profiles
tides and tidal phenomena are studied because : • safe coastal navigation requires knowledge of tide stage and flow • Dispersion and aggregation of shore-line materials are affected by tides • flooding can be enhanced or reduced by tide ranges and phases • large tide ranges can be used to run generators and supply power • tide stages and flow can signifi-cantly affect nearshore and estuary biological, chemical, and geological distributions. These four cranes, each valued at $ 1.25 million, entered San Francisco Bay on June 14, 2002 arriving from Shanghai, China. Their purpose is to raise 40’ long containers from cargo ships. They had to pass under the Oakland Bridge to reach their destination. The tidal range on that day was 4.1 feet and the bridge had a vertical motion of 6 inches. Detailed knowledge of the tidal cycle was necessary for the piloting that brought the vessel under the bridge as the cranes cleared the bottom of the bridge by six feet.
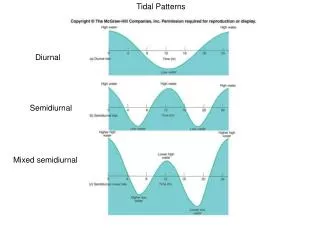
Types of Observed Tides Diurnal Tides fluctuations are largely due to the changes in the Moon’s declination (angle from the celestial equator) Semidiurnal Tides fluctuations are due to the relative positions of the Sun and Moon Mixed Semidiurnal Tides the most commonly seen waveform reflecting local basin geometry and the moon’s declination
patterns in observed tidal elevations There are three types of tides recognized for classification by their patterns of water elevation : diurnal tides are those exhibiting one high and one low elevation each 24 hours semi-diurnal have two equal high and low elevations each 24 hours mixed tides have two unequal high and low elevations each 24 hours. At any geographic position on a coastline, the types of tide vary among the three above. However, the Equilibrium Theory indicates that only one type of tide will occurs at a given latitude. Actually it is found that the types of tides are not limited to certain latitudes. This is a major reason the Dynamic Theory is used to predict tides. The Ttheory takes into account the effects of a basin’s shape and bottom topography in the prediction of a tide wave’s propagation and form. Remember that the partition of a shallow water wave’s energy can shift between kinetic and potential and this respectively reflects changes in the waves speed and elevation. These shifts affect the result of superposition of types of waves with one another at a given location and in this manner the Dynamic Theory can reproduce a wide variety in elevations irrespective of latitude. Diurnal tides are fundamentally composed of lunar, solar and the lunar-solar partial tides. Each of these partials contributes a particular type of gravitational influence and in this case the factor that is the dominant one is the moon’s declination, that is, the angle of the moon’s position relative to the celestial equator. Diurnal tides have relatively small ranges of elevation and are rare around the globe being found in the Gulf of Mexico, Australia and Antarctica.
Semi-diurnal tides are strongly influenced by the relative positions of the moon and sun relative to the center of the earth. They are common along Atlantic and Indian ocean coastlines. Their elevations are normally 2 to 4 meters and can reach 6 meters [Bay of Fundy]. Mixed tides are those that occur due to the declination of the moon and nearby local effects such as the configuration of the shoreline and the depths of local bottom topography. These tides are found along Pacific coasts and are influenced by the superposition of waves associated with a large number of amphidromic systems. Mixed tides can have relatively high elevations, 2 to 6 meters. coastal currents associated with tides There are horizontal water movements, currents, that accompany the rise and fall of tide elevations in the shallow depths along coastlines. Fundamentally, the periodi-cities of the currents are the same as the rise and fall of the elevations, diurnal and semidiurnal . In general, count on this : when tide elevation is changing most rapidly, flow is strongest. However, time differences between the vertical rise and fall of elevations and turning points in the horizontal flow of tidal currents can arise in particular geographic locations. The cause of these differences often are the con-strictions in estuary or bay entrances or perhaps seaward flow of river waters through entrances or the influence of local winds. Whatever and whenever differences occur, in the filling or, especially, the draining of semi-enclosed bodies of water, they can be analyzed while referring to temporal phasing between elevation and flow events.
There are two tide patterns observed in the Gulf of Mexico, diurnal and mixed. Tides along the Texas coastline are diurnal. The western coast of Florida and Yucatan Peninsula tides are mixed.
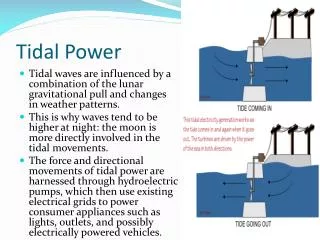
about astronomical tides Tides are what we call the regular rise and fall of sea level during the 24 hours of a day. They have very long wavelengths, thousands of kilometers due to their generation by the sweeping of the attraction of the moon over the ocean, and periods of 12.4 or 24.8 hours due to the repetition of the generation impetus [see two bulges]. The ratio of depth to wavelength [~0.05] always marks them as shallow water waves and we reckon their speed by the square root of the product of the acceleration of gravity and depth. In 4000 meters of water they propagate at approximately 200 meters per second and for shorthand we say that tides propagate energy at speeds proportional to water depths. The elevation by which a tide’s vertical excursion is assessed is known as the tide datum and this is not always the same sea level. Country-to-country, the choice of the datum varies : it often refers to the mean of observed low tides or it can even be the lowest tide level ever recorded at a given location. Tides affect navigation, therefore commerce, and for this reason their prediction has long been the subject of observation, analysis, and modeling. Tide waves are produced by the physical combination of the gravitational force of attraction by the moon and sun with the centrifugal force associated with the rotation of the earth about center of mass of the earth and moon taken together. Both forces deform the sea water mass and the results are bulges on the ocean surface. The superposition of these bulges are the complete tidal elevation, both above and below a datum, around the globe. The initial model of the tides was possible after the effect of gravitational attraction was understood and therefore Isaac Newton was the physicist that developed the equilibrium theory of tides. There were several assumptions made by Newton to simplify his model : the globe was completely covered with water; the water depth was deep enough so there was no interaction with the bottom; the forces producing the tide are everywhere in balance. The model indicates there are two bulges : one located directly under the moon and one opposite the moon, on the other side of the globe .
This graphic illustrates how the equil-ibrium forces are balanced over the globe; the centrifugal force [thin white vector] within earth and moon system balances the forces of gravitational attraction [blue vector] between earth and moon; the resultant of centrifugal and gravitational forces is known as the tide-producing force [thick white vector]; there is a force known as the tractive force; it is a component of the tide-producing force along the sea surface : the tractive force is the one that makes the water move. To moon Tide-producing force Gravitational force due to Moon Centrifugal force
the tractive forces that raise the two bulges of Newton’s Equilibrium tide model Note that half-way around the globe from a point directly under the moon the tractive effort, the force on the water along the surface, goes to zero. It reverses toward a point on the globe directly opposite the one under the moon. In each half, the maximum tractive effort occurs half-way from the zero to each of the points [see the maximum length of the red vectors]. The tractive effort directly under the moon and opposite is also zero. These are the forces acting along the surface of Newton’s model that are responsible for and hold the bulges of the equilibrium tide in relation to each other and the moon.
Superposition of the two bulges that combine to form the tidal envelope on a globe.
equilibrium theory results When reasoning with the results of his theory, Newton considered that the globe was rotating beneath the bulges; at a given geographic location high tides were present when the region was under a bulge and there was a low tide when the same region was as far away as possible from a bulge. So Newton’s theory can explain why there are spring and neap tides. Spring tides are tides that have larger than average ranges. They are generated when the Earth, moon and sun are aligned along a line through their centers, a juxtaposition occurring twice a month at new moon and full moon. At this time, the high tides are at their highest and low tides at their lowest. These highs and lows come about because the superposition of the gravitational attractions of sun and moon yields maximum reinforcement of the bulges. Neap tides occur when there is the greatest mis-alignment of the earth, sun and moon; that is when the line between earth and moon centers is at right angles to the line between the earth and sun centers; that is minimum superposition of the gravitational fields. A far as astronomical appearances, Spring tides happen at new and full lunar phases; neap tides when the moon is in first- and third-quarter phases . Newton’s theory was a significant step in tide understanding. Yet there are tide characteristics that it can not explain : it can not yield the times when given stages of the tide will happen or explain why there are diurnal, semi-diurnal or mixed tide patterns. For that information, one must turn to another tide theory.
dynamic theory of tides The physicist Pierre-Simon Laplace was impressed with Newton’s theory and its results. He realized that a more complete prediction would require a model that is more realistic, and therefore more complex. His theory would include additional physical features that would also be expressed mathematically. Like all appropriate theoretical developments, this new theory had to include Newton’s forces : gravity and the physical effect of the earth’s rotation. The Laplace contributions are called partial tides and four of them, lunar daily, solar daily, lunar and solar semi-dailys, are mechanisms that provide for the accurate prediction of approximately three-quarters of the observed tides. At present, nearly 400 of these “partial tides” have been identified. The dynamic theory assumes that the tides are enclosed in an ocean basin. The tide circles around the basin, counterclockwise in a northern hemisphere, under influence of the basin boundary’s shape and the bottom topography depth. The wave takes the form of a standing wave rotating about a central node where the tidal range is zero. The edges of the basin are the antinodes. A rotary standing tide wave circles the basin once every twelve hours and illustrations usually show the progress of the wave every hour. The amphidromic pattern has three aspects : the central nodes are called amphidromic points; the lines radiating outward from the amphidromic point to the basin boundaries are known as cotidal lines along which agiven phase of the waves occur at the same time. There are lines that encircle the amphidromic point known as corange lines, lines that connect points that have equal tidalranges.
The DYNAMIC theory of astronomical tides considers the motion of the waves over ocean basins under the influence of bottom topography, earth’s rotation, and blocking effects of continents on propagation. A physical tide model represents a wave that rotates counter-clockwise in the northern hemisphere around a basin, once a day in a diurnal case, and twice for semi-diurnal tides. In a time sequence, a high tide at the western edge of a basin creates a pressure gradient sloping down and away to the east. A geostophic analysis of this gradient yields a current that moves water toward the equator. At the equator, waters gather (from both sides), a pressure gradient sloping downward to the north supports the notion of geostrophic flow eastward and so on, until the basin has been boxed. This semi-circular motion naturally defines an inner location around which the wave turns and at which there is no tide elevation or motion; it is known as an amphidromic point. Normally there is one per geographic basin as shown to the left. From each of these points, lines that define the position of any phase of the wave emanate in a wavy fashion that indicates the influence of the bottom topography on wave propagation speed. The numbers run from 0 to 12 (0) and indicate an elapsed time of one hour. Why are some of these lines that indicate, say a wave crest position, closer to one another than others ?
Open ocean tides are regulated by the rotation of the tide waves in an amphidromic sytsem. In the system, the waves rotate about a central amphidromic point, a location at which there is no discernable tidal response. A simple model of this system is composed of a shallow water standing wave that rotates counterclockwise in a constant depth northern hemisphere ocean about a circular, enclosed basin. The wave’s amplitude excursion, positive elevation and negative, are maximum at opposite basin edges and zero at the amphidromic point. A complete rotation around the basin is accomplished every twelve hours.
… world wide distribution of amphidromes and co-tidal lines … note the amphidromic point off the west coast of the United States and, in particular, the hour 8 cotidal line north of Seattle …
Tides can produce remarkable phenomena through combinations of reflections from continental land masses and changes of propagation direction and speed brought about by refraction due to changes in bottom topography. The large range of tidal elevation in Canada’s Bay of Funday is a well known example. Even more striking phenomena can occur when a tide wave approaches a large island adjacent to a continental land mass. As a tide wave propagates slower in shallow waters between the island and coast it continues to propagate with a faster speed in deeper waters offshore of the island. What can occur is the wave meeting itself along the inner portion of an island with a difference in phase and therefore tidal elevation. Locations wherein it meets itself wrapping around the island can give rise to events that were beyond explanation prior to a comprehensive understanding of the ocean’s response to the forces of tidal dynamics. A famous phenomenon takes place off the western coast of Greece between the mainland and the island of Euboea at the city of Halkis. The combination of tidal phase differences and the action of wind systems over the inner waters can produce a varying number of reversal in flow past Halkis. There can be as many as five or six changes in flow direction. On the western Canadian coast, there is a similar event that gives the appearance of a seam in the waters of Dixon Entrance at the northern confluence of inshore and offshore waters between the Queen Charlotte Islands, Prince of Wales Island and the coast of British Columbia. The next slide shows the meeting of the two phases of the tide.
an offshore tidal phenomena A tide wave from the Pacific rotates counter-clockwise around an amphidrome centered in the Pacific Ocean near 35 degrees north and 145 degree west longitude. It sweeps along the west coast of the North American continent, enters Queen Charlotte Sound and propagates northward through Hecate Strait toward Dixon Entrance at a slower speed [due to shallower depths on the continental shelf] than its movement at sea along the western side of the Queen Charlotte Islands into the Entrance. Within the Entrance the two parts of the wave, now out of phase, meet and due to different elevations, produce a discontinuity in the water level herein observed at Rose Spit. Wind waves, running on either side of the discontinuity, break against one another.
here is some additional information on Huricanes beyond the text …. specifically about Texas events ….. … two Hurricanes that struck Texas … Carla SEP 1961 Celia AUG 1970
hurricanes that have made landfall in the northwestern gulf coast region
Hurricane Celia made land fall at Aransas Pass and Port Aransas in August, 1970. This storm was unique in the fact that, although not the biggest to strike this coastal area, it brought wind gusts that were greater than most hurricane sustained winds. Celia had sustained winds of 130 mph with gusts of over 180 mph. The structural damages inflicted, in today’s dollars, exceeded 190 billion dollars yet there were only 9 deaths and 490 injuries.
Hurricane Celia : note the low pressure center and low wind values as the wind direction switches during passage of the system
One way of analyzing the intensity and water damage from a hurricane is to plot high water values versus coastline. Note the highest value at Aransas Pass as the system center passed inland slightly south of this bay entrance.
Carla made landfall between Port O’Connor and Port Isabel in September of 1961; it was one of the strongest systems to strike Texas in half a century. Sustained winds of more than 150 mph over the shelf marked it as a category 5 storm on the Saffir-Simpson intensity scale; winds were lower, 120 mph at landfall. Forty-three deaths were attributed to this storm.
Another way to assess possible damage is to plot water level excursion at a specific location of interest. At Galveston, the high waters were more than 2 meters above the background water level.