Download
1 / 11
110 likes | 209 Views
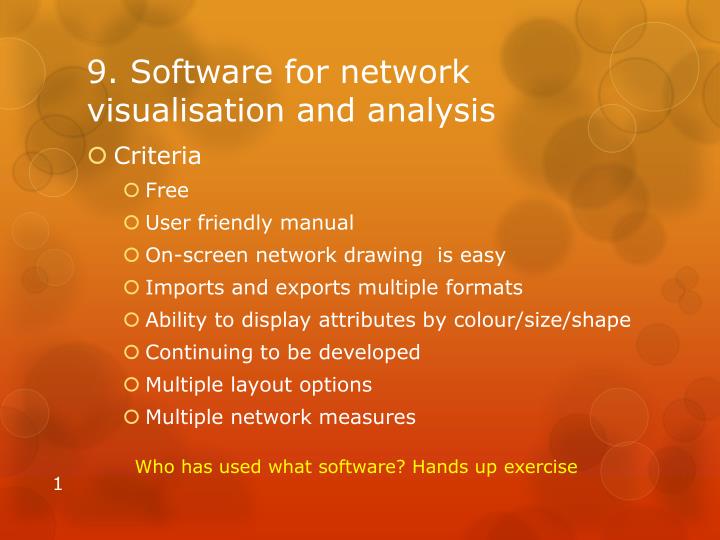
9. Software for network visualisation and analysis. Criteria Free User friendly manual On-screen network drawing is easy Imports and exports multiple formats Ability to display attributes by colour/size/shape Continuing to be developed Multiple layout options Multiple network measures.

E N D
9. Software for network visualisation and analysis • Criteria • Free • User friendly manual • On-screen network drawing is easy • Imports and exports multiple formats • Ability to display attributes by colour/size/shape • Continuing to be developed • Multiple layout options • Multiple network measures Who has used what software? Hands up exercise
NodeXL, an Excel Template • Free, manual exists, continuing development • You can give nodes and links as many different attributes as desired • Including objective descriptions, results data • And these can be visualised in the colour/size/shape of nodes and links
yED, diagramming software • Free • Wide range of ways of visualising differences in nodes and links • Copes with Excel files that vary in their layout • Diagrams can be uploaded as interactive web pages
UCINET & NetDraw • The most widely used SNA package • Lots of data manipulation and network analysis tools • Lots of layout and filtering options • Continually being developed • Steep learning curve • Courses available
Visualyzer • Very easy on screen drawing • User friendly manual • Attributes of nodes and links can be made visible by mouse-over, clicks and coding • Expensive • Not under continuing development
The attributes of the actors can be made visible by cursor rollover+shift
10. Participants’ plans for possible post-workshop applications • Participants (in 3’s) brainstorm a possible network mapping exercise, with each identifying: • What sort of project ? • At what stage ? • Using what sort of data ? • Involving who ? • To document a plan or a current reality ? • At what level of detail ? 30
11. Workshop Evaluation • One page feedback form • Post-workshop requests for help • 1 hour for each person, by skype and or email • Follow up participants’ survey • On possible post-workshop connections between participants 30
Qualitative feedback.. • Like and should keep • Don’t like, but should improve and keep • Don’t like and should remove • Missing and should be added
12. Resources www.mande.co.uk PW: Prague