Download
1 / 9
90 likes | 114 Views
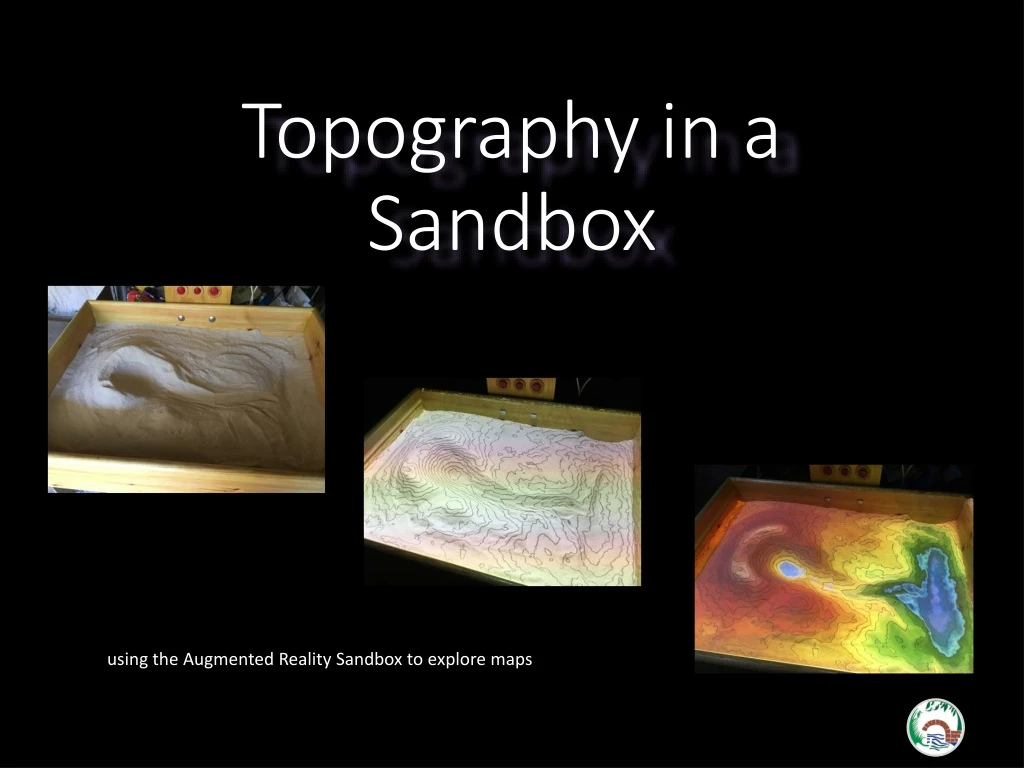
Topography in a Sandbox. using the Augmented Reality Sandbox to explore maps. the project. The aim of this project is to look at the landscape of an area, see how the hills, valleys and other features of the area are represented on a map, and what the map means in ‘3D’.

E N D
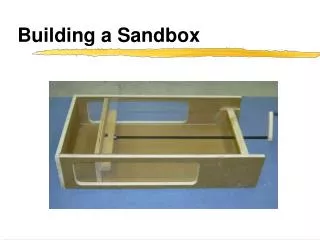
Topography in a Sandbox using the Augmented Reality Sandbox to explore maps
the project • The aim of this project is to look at the landscape of an area, see how the hills, valleys and other features of the area are represented on a map, and what the map means in ‘3D’. • The project uses two styles of map – one to show the area, one to show the contours of that area, and introduces the Augmented Reality Sandbox to show how the map appears in a 3D model.
find the area - reading a map • Find out which map reference you want for your project using the Ordnance Survey Grid reference system – this example is for the area covered by the River Wey Trust • The link here explains further how the grid reference works https://getoutside.ordnancesurvey.co.uk/guides/beginners-guide-to-grid-references/ • We want a specific square area, so look at the map and find and identify the area you want, to the level of two digits (eg SU83). • Go to the OS Maps datasets (LOCATION TO BE PROVIDED) and download the data for that grid
record • The place you selected. • The name or description of a significant feature in the area you have chosen, and the OS Grid Reference to 4 digits of that feature. • The OS Grid Reference to 2 digits of the area you have downloaded.
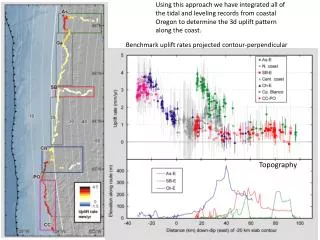
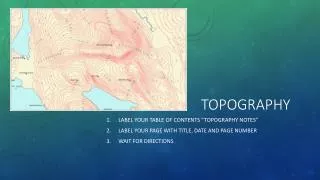
print and review For the area selected, print both the map and the contour line map. They will look something like these images. Review and select: Looking at both maps and using any other maps or information you have, identify the high and low areas and see how the contour lines are used to show the heights and the steepness (gradient) of slopes. Pick an area to work with (choose one which has some slopes, hills and valleys!) and mark the heights the lines represent on the contour line map either by numbers or using colour shading to show hills and valleys.
in the sandbox Model Using the Sandbox, shape the sand to show the area you have selected, using the contour map as a guide. The Sandbox can be set to show only the contours (ie without colour shading) and that may help in matching your area contours. Capture Using the Screen Capture button, record an image of the landscape you have generated and compare that with the contour line map.
explore • On your model, look at where the watershed lines would be, and test those with ‘rain’ • Change the landscape and see the effect this has on water - use the ‘rain’ and ‘flood’ to look at what happens. • Does the volume of water change the watershed line? • From the model developed from your map, explain why the roads run as they do – explain the impact of landscape (hills, slopes, rivers) on the way humans have used the landscape. • See where human influence has changed landscapes - road or railway cuttings - and explain how that might impact on how a watershed works
other areas to explore • Dams • Floods • Different shapes/routes of rivers Record Take notes to describe the changes you have made and their impact, and use screen capture images to show changes and the impact they have on the landscape.
checklist of completed tasks • The name or description of the place you selected. • The name or description of a significant feature in the area you have chosen. • The OS Grid Reference to 4 digits of that feature. • The OS Grid Reference to 2 digits of the area you have downloaded. • Print of the map. • Print of the contour line map. • Screen Capture image of the landscape you have generated. • Notes on how close that is with the contour line map. • Notes to describe the changes you made to the sandbox model and their impact, with screen capture images