Download
1 / 22
220 likes | 486 Views
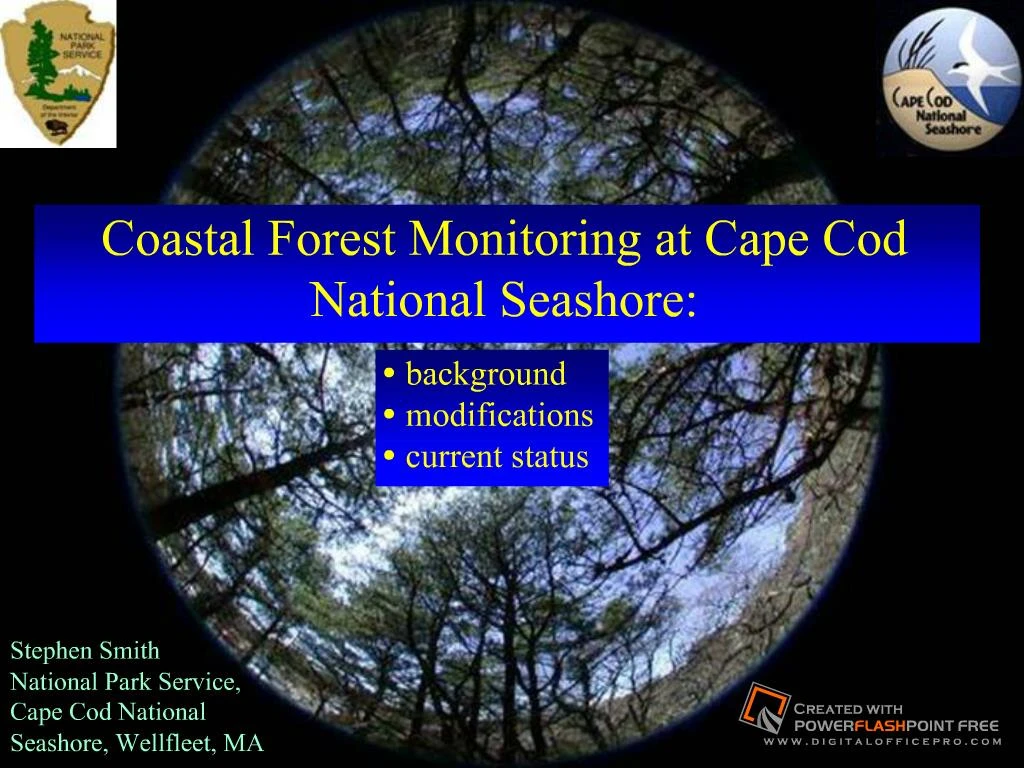
Coastal Forest Monitoring at Cape Cod National Seashore: ... Forests are generally young (~150 yrs) and are largely a reflection of land use history ...

E N D
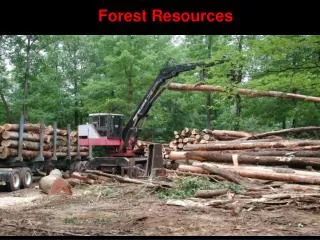
Slide 2:CACO Forest Resources - background
Forests and woodlands occupy a large part (~60%) of the CACO landscape Forests are generally young (~150 yrs) and are largely a reflection of land use history (e.g., agricultural practices of European settlers, clear-cutting by military, etc.), the coastal climate, and sandy soils.
7 main forest types Pitch pine Pine-oak (black & white) Oak (black and white) Red Maple Beech Black Locust * Atlantic White Cedar MAJOR NATURAL INFLUENCES - coastal weather conditions (e.g., salt-spray, wind) - nutrient-poor, droughty, acidic soils - extreme weather events (e.g., hurricanes) - insects (gypsy, winter moths, pine tip moths, pine beetles) - invasive species ANTHROPOGENIC INFLUENCES - land-use history - fire suppression - air pollution (NOx, SO2, O3, etc.) - landscape fragmentation - global change salt spray damage to pitch pines History of protocol development Dr. William Patterson (UMASS) et al. (1983) established sampling points at 21 sites to model fire regimes in different forest types 16 of the above sites were re-located and re-sampled in 1991 (Chokkalingham 1992) to assess 10-yr. trends (including gypsy moth impacts) CACO funded for I&M protocol development (~1996) Patterson�s sampling network incorporated into development of I&M protocol - transition to new methodology recommended (Barrett 1999) 16 sites that Chokkalingham surveyed in 1991 were re-located and re-sampled in 2001 (Hubbard) � sites sampled by original and new methods (to compare and evaluate) more sites added in 2002/2003 (total 39), revisions and additions to methods (Smith) Original sampling design (developed by Patterson et al. 1983 and used in 1991 and 2001 surveys) Tree sampling at each point using angle gauge (variable-radius plots, area surveyed depends upon tree size and distance) Shrub and herbaceous cover visually estimated in 1m2 plots centered on each stake Each site: multiple point-sampling locations throughout �stands� of pine, pine-heathland, and pine-oak forests I II IV III 10 m contiguous 4-square of 10 x 10 m plots; fixed area monitors exact same space (individuals) over time nested plots for other strata being used in other vegetation protocols at CACO (heathlands, dune grasslands) and other Parks 0.4 ha 3.3 m 1 m Near Ground (shrubs) (0.5-2 m) Ground (herbs and sub-shrubs) (<0.5 m) Sampling methodology change proposed by Barrett in 1999 and implemented by Andy Hubbard in 2001 (based on design of Peet et al. 1998) Establishment of nested, modular plots (Hubbard - 2001) relative to original point-sampling grid (Patterson - 1983) * 2001 - data collected by both methods I II III IV stake best representing stand character Comparisons of point sampling to fixed area (module) data: Basal Area Comparisons of point sampling to fixed area (module) data: Tree density Cross-walking data collected by original vs. new methods where correlations are weaker, sensitivity for detecting change is reduced but significant differences more likely to be real given added level of variability may not be feasible or useful to analyze some parameters over some parts of the historical record 2011: sample by both methods again to see whether both are picking up same temporal shifts can always re-sample using original methods at any time (for 16 sites) 1981 1991 2001 2011 2021 Point sampling Modules Revisions to Protocol by Smith (2002-2003) Solution - added 23 new sites (random selection within polygons from 2000 vegmap defining each type) to include red maple, black locust, oak, and Atlantic White Cedar types Network of sites in 2001 only included pine and pine-oak types 2001 2002 Difficulty re-establishing plots in the exact same locations based on a single corner location + compass bearings; can result in inclusion or exclusion of a large number of trees N stake Solution: stakes at all four corners stake stake stake stake No way to track growth of individual trees Solution: tree tags put in at 20 cm above DBH point also helps delineate plots (boundary trees) standardizes DBH measurement points DBH (20 cm below) Canopy Cover � analysis of digital images taken with a fish-eye lens Specs: height 2 m, center of �four-square� Added parameters Seedling/sapling counts (< 2 m) of all tree species: potential trajectory of change (succession) success/failure of recruitment Categories healthy broken bole canker gall tumor conk resinosis leaf damage leaf necrosis leaf discoloration other Qualitative data on the health of every tree in plot Reviewer # 1 � major comments The goals and objectives of this protocol, as they are related to management objectives, are not clearly articulated � we had not developed management objectives at the time (and we�re still working on them) Sampling objectives need to be explicitly tied to sampling scheme � our sampling scheme was based upon adaptations and extrapolations of existing methods; old sites were included in the new protocol to make use of legacy data Sample sizes not large enough to detect meaningful change within specific community types � may be true, but won�t know until second set of data is collected and can do real power analysis Sampling scheme not appropriate for detecting changes across entire landscape since selection of sites was based on stratification by type � this is what was originally done by Patterson, so we continued for the sake on consistency; also there are smaller areas of important forest resources (Atlantic White Cedar Swamp) that would have been missed if a fully randomized selection process was used Use of 4 subplots (modules) at each site may be oversampling; would be better to have fewer modules per site and more sites � Barrett, Hubbard�s intent was to provide some level of within-site replication so that site to site comparisons could be done in a statistically-valid manner but I agree with this comment! Note: Comments from reviewers 2 and 3 not received yet revise protocol where possible to accommodate reviewer issues 2nd round of data collection in 2011 develop and integrate remote sensing as a complimentary tool Future work Acknowledgements: Dr. William Patterson (UMASS) Elizabeth �Za� Barron (UMASS/NPS-CACO) Alison Boutin (SCA) Evan Gwilliam (NPS-CACO) Dr. Andy Hubbard (NPS-SOAR)