Download
1 / 50
500 likes | 584 Views
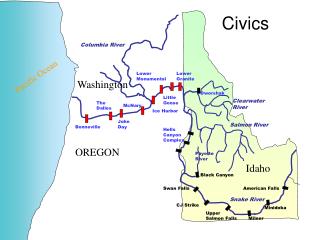
Status of Columbia River salmon and links to flow: What we do and do not know. Presentation to Northwest Power Planning Council December 11, 2002. John.g.williams@noaa.gov Bill.muir@noaa.gov Steven.g.smith@noaa.gov Rich.zabel@noaa.gov. Outline. Historic flow, juvenile travel time and

E N D
Status of Columbia River salmon and links to flow: What we do and do not know Presentation to Northwest Power Planning Council December 11, 2002 John.g.williams@noaa.gov Bill.muir@noaa.gov Steven.g.smith@noaa.gov Rich.zabel@noaa.gov
Outline • Historic flow, juvenile travel time and • survival, and adult returns
Outline • Historic flow, juvenile travel time and • survival, and adult returns • Present flow, juvenile travel time and • survival, and adult returns
Outline • Historic flow, juvenile travel time and • survival, and adult returns • Present flow, juvenile travel time and • survival, and adult returns • Present stock status and link to flow
Outline • Historic flow, juvenile travel time and • survival, and adult returns • Present flow, juvenile travel time and • survival, and adult returns • Present stock status and link to flow • Uncertainties
Salmonids evolved to migrate under flow conditions with a natural hydrograph. Due to the small size of smolts, the limited ability to store energy reserves, and the long distance they must travel, fish rely tremendously on flow (water velocity) to move them to the ocean.
A strong and consistent relationship exists between flow (water velocity) and travel time
Travel time impacts arrival to and through the hydropower system and thus, timing to the estuary and ocean.
In 2001, little to no spill at all dams. In other years, spill to 2000 BiOp levels or to the gas cap.
In 2001, little to no spill at all dams. In other years, spill to 2000 BiOp levels or to the gas cap.
Above some threshold average • survival appears to vary little, is • relatively high, and does not • correlate with flow.
Above some threshold average • survival appears to vary little, is • relatively high, and does not • correlate with flow. • Below the threshold, survival is • lower.
Above some threshold average • survival appears to vary little, is • relatively high, and does not • correlate with flow. • Below the threshold, survival is • lower. • The relationship between flow • and survival at the lower range is • not strong.
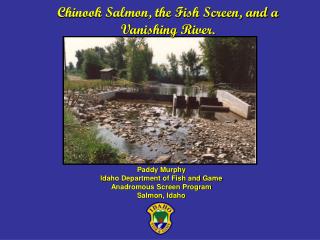
We presently can not predict the window of good estuary/ocean conditions
Spring-summer chinook salmon • Transported/non-transported (marked above LGR) • _________________________________________ • Year Hatchery Wild • _________________________________________ • 1995 1.73 (26) 0.89 (9) • 1996 1.28 (6) 0.48 (2) • 1997 1.32 (232) 1.16 (4) • 1998 1.25 (896) 0.77 (17) • 1999 1.53 (1211) 1.10 (73) • 2000 1.79 (1002) 0.55 (48) • Geo. Mean = 1.51 = 0.86 (Bolded data) • Geo. Mean = 1.47 = 1.07 (All data)
Steelhead Transported/non-transported (marked above LGR) _________________________________________________________________________________________________________ Year Hatchery Wild _________________________________________________________________________________________________________ 1995 0.83 (22) no data 1996 1.05 (7) 3.50 (2) 1997 3.00 (10) 2.24 (2) 1998 0.49 (8) 0.30 (2) 1999 0.74 (14) 1.13 (10) 2000 2.57 (17) 1.73 (18) 2001 0.31 (1) 0.29 (3) Geo. Mean = 1.48 = 1.40 (Bolded data) Geo. Mean = 1.05 = 0.96 (All data)
Conclusions • Construction of dams has decreased • water velocities and increased juvenile • travel time.
Conclusions • Construction of dams has • decreased water velocities and • increased juvenile travel time. • Under low-flow conditions, • juvenile survival decreases.
Conclusions • Lack of a strong flow survival relationship • from LGR-MCN under generally good flow • conditions is not surprising given the high • estimated juvenile survival in this reach.
Conclusions • Lack of a strong flow survival relationship • from LGR-MCN under generally good flow • conditions is not surprising given the high • estimated juvenile survival in this reach. • Most losses from LGR-MCN occur from • dam passage, leaving little mortality in the • reservoirs where flow would affect survival • the most.
Conclusions • Lack of a strong flow survival relationship • from LGR-MCN under generally good flow • conditions is not surprising given the high • estimated juvenile survival in this reach. • Most losses from LGR-MCN occur from • dam passage, leaving little mortality in the • reservoirs where flow would affect survival • the most. • Lack of a strong flow/survival relationship • in this short reach does not support an end • to flow augmentation.
Conclusions • Adult returns vary widely depending • on timing of the juvenile migration • through the estuary and into the • ocean.
Conclusions • Adult returns vary widely depending • on timing of the juvenile migration • through the estuary and into the • ocean. • We can not presently predict when • favorable estuary/ocean conditions • will exist.
Conclusions • In recent years and over a broad • range of flows, SARs have increased • and brood year to brood year • ratios (calculated as escapement to • Lower Granite Dam plus catch) • are above 1; however, SARs are • below levels estimated for the 1960s
Conclusions • NMFS is presently conducting research • to relate juvenile migration history and • experience (including flow) within the • hydropower system to adult returns.
Conclusions • NMFS is presently conducting research • to relate juvenile migration history and • experience (including flow) within the • hydropower system to adult returns. • This includes research to understand the • relationship among time of ocean entry, • physical, and biological characteristics of • the estuary and plume environment, and • adult return rates.