Download
1 / 8
80 likes | 213 Views
Temperature, Salinity and sigma-t for WOCE line P15 in the Central Pacific. Problem 1(1). TS Diagram for WOCE line P15 in Central Pacific. Problem1(2). Oxygen and AOU for WOCE line P15 in Central Pacific. Problem2(1). Nitrate and Phosphate for WOCE line P15 in Central Pacific. Problem3(1).

E N D
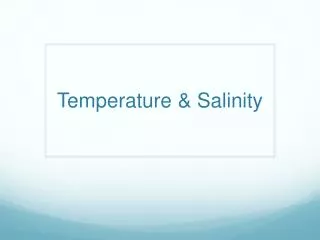
Temperature, Salinity and sigma-t for WOCE line P15 in the Central Pacific Problem 1(1)
TS Diagram for WOCE line P15 in Central Pacific Problem1(2)
Oxygen and AOU for WOCE line P15 in Central Pacific Problem2(1)
Nitrate and Phosphate for WOCE line P15 in Central Pacific Problem3(1)
Total Alkalinity and TCO2 for WOCE line P15 in Central Pacific Problem4(1)
Nitrate in the upper 500m for WOCE line P15 in Central Pacific Problem5(1)
Problem2-2 In surface waters there is an equilibrium between O2 of the water and O2 of the atmosphere. In the surface water itself variation in concentration of saturation O2 [O2*] Temperature and Salinity changes: colder and fresher water implies higher [O2*]. Supersaturation is caused by Photosynthesis. Below the surface waters – including the euphotic zone – the only change in O2 is due to respiration of heterotrophic organism, which remove O2. Therefore, the longer the watermass has not been at the surface the lower the O2 concentration. AOU (apparent oxygen utilization)= [O2*] – measured[O2]. When [O2*] decreases AOU and O2 behave oppositely. This means the older the watermass, the more AOU will it contain. Therefore, after the AAIW leaves the surface and “gets older” AOU decreases while moving down and norhtward. Problem3-2 NO3-, PO4--- and AOU show similar behavior: they increase in the subsurface waters due to respiration. The NO3-, PO4--- plot shows a linear relatoinship with a slope of 14.85 which is close to the Redfield Ratio of 15: 1(CH2O)15(NH3)15H3PO4+135O2->1H3PO4+15HNO3+120H2O+105CO2 AOU and NO3- follows the redfield ratio only in the upper part of the data, but below there is no AOU, but NO3- variation. Especially HNLC (High Nutrient low chlorophyll) areas can cause this nonlinear behavior: they have NO3- and PO4--- in surface waters, the presence of these compounds which is there as a “starting” condition causes the variation. Problem5-2 HNLC areas have high concentrations in NO3- and PO4--- indenpendend from seasonal variation in surface waters, whereas chlorophyll a concentration, and therefor phytoplankton concentration and productivity are low, in this case those areas can be found at the equator and the subarctic regions (marked as a box on the plots). Fe limitation is considered to cause the lack in productivity. Fe is an essential nutrient for phytoplankton productivity.
Problem4-2 Alkalinity decreases with carbonic production and increases with its dissolution. The Alkalinity max in the NPacific is deeper then the TCO2, because sediments at the bottom cause carbonate dissolution and therefore and increase in Alkalinity from the bottom up. TCO2 decreases in waters close to the surface due to photosynthesis and carbonate production. TCO2 increases when it is consumed by organisms or when carbonate dissolution takes place in the deep sea. Putting this together, TCO2 is distributed like a nutrient and therefore TCO2 and AOU show similar distributions, emphasizing the remineralization and production of organic matter. All this means, that variations in the TCO2-alkalinity plot are either cause be carbonate production/dissolution and/or organic matter production/remineralization. Here is seems to be a combination of both at least in the deep sea region with high AOU, where there is a slope of 0.7. Other regions are harder to analyze due to watermass mixing. If there would be a region where only the first occurs, the slope is expected to be ½: For every mole carbonate production, alkalinity decreases by 2 moles. If only the latter occurs the slope would be infinite. From the bottom up carbonate dissolution takes place and on the other hand TCO2 increases.