Download
1 / 34
340 likes | 505 Views
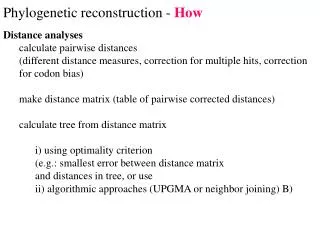
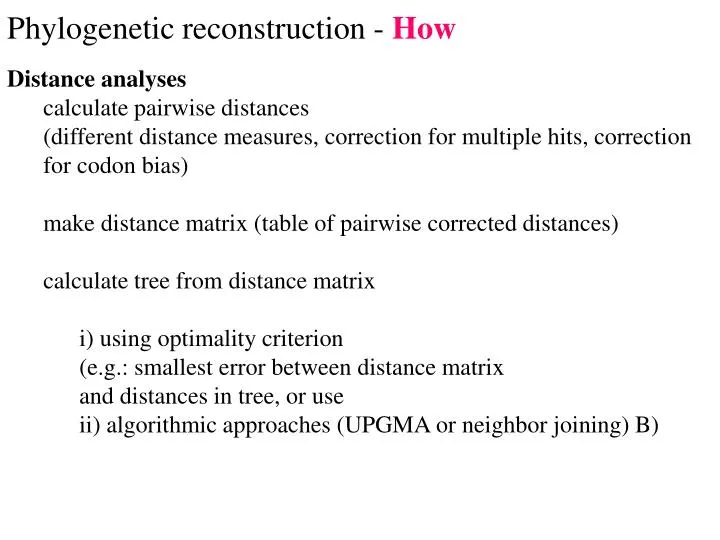
Distance analyses calculate pairwise distances (different distance measures, correction for multiple hits, correction for codon bias) make distance matrix (table of pairwise corrected distances) calculate tree from distance matrix i) using optimality criterion

E N D
Distance analyses • calculate pairwise distances • (different distance measures, correction for multiple hits, correction for codon bias) • make distance matrix (table of pairwise corrected distances) • calculate tree from distance matrix • i) using optimality criterion • (e.g.: smallest error between distance matrix • and distances in tree, or use • ii) algorithmic approaches (UPGMA or neighbor joining) B) Phylogenetic reconstruction - How
Parsimony analyses • find that tree that explains sequence data with minimum number of substitutions • (tree includes hypothesis of sequence at each of the nodes) • Maximum Likelihood analyses • given a model for sequence evolution, find the tree that has the highest probability under this model. • This approach can also be used to successively refine the model. • Bayesian statistics use ML analyses to calculate posterior probabilities for trees, clades and evolutionary parameters. Especially MCMC approaches have become very popular in the last year, because they allow to estimate evolutionary parameters (e.g., which site in a virus protein is under positive selection), without assuming that one actually knows the "true" phylogeny. Phylogenetic reconstruction - How
Elliot Sober’s Gremlins Observation: Loud noise in the attic ? Hypothesis: gremlins in the attic playing bowling Likelihood = P(noise|gremlins in the attic) P(gremlins in the attic|noise) ? ?
Likelihood estimates do not take prior information into consideration: e.g., if the result of three coin tosses is 3 times head, then the likelihood estimate for the frequency of having a head is 1 (3 out of 3 events) and the estimate for the frequency of having a head is zero. The probability that both events (A and B) occur Both sides expressed as conditional probability If A is the model and B is the data, thenP(B|A) is the likelihood of model A P(A|B) is the posterior probability of the model given the data. P(A) is the considered the prior probability of the model.P(B) often is treated as a normalizing constant.
P(data|model, I) P(model|data, I) = P(model, I) P(data,I) Likelihood describes how well the model predicts the data Bayes’ Theorem Posterior Probability represents the degree to which we believe a given model accurately describes the situation given the available data and all of our prior information I Prior Probability describes the degree to which we believe the model accurately describes reality based on all of our prior information. Normalizing constant Reverend Thomas Bayes (1702-1761)
Illustration of a biased random walk Image generated with Paul Lewis's MCRobot Figure generated using MCRobot program (Paul Lewis, 2001)
Else: spectral analyses, like evolutionary parsimony, look only at patterns of substitutions, Another way to categorize methods of phylogenetic reconstruction is to ask if they are using an optimality criterion (e.g.: smallest error between distance matrix and distances in tree, least number of steps, highest probability), or algorithmic approaches (UPGMA or neighbor joining) Packages and programs available: PHYLIP, phyml, MrBayes, Tree-Puzzle, PAUP*, clustalw, raxml, PhyloGenie, PyPhy
Bootstrap ? • See here
written and distributed by Joe Felsenstein and collaborators (some of the following is copied from the PHYLIP homepage) Phylip PHYLIP (the PHYLogeny Inference Package) is a package of programs for inferring phylogenies (evolutionary trees). PHYLIP is the most widely-distributed phylogeny package, and competes with PAUP* to be the one responsible for the largest number of published trees. PHYLIP has been in distribution since 1980, and has over 15,000 registered users. Output is written onto special files with names like "outfile" and "outtree". Trees written onto "outtree" are in the Newick format, an informal standard agreed to in 1986 by authors of a number of major phylogeny packages. Input is either provided via a file called “infile” or in response to a prompt.
What’s in PHYLIP Programs in PHYLIP allow to do parsimony, distance matrix, and likelihood methods, including bootstrapping and consensus trees. Data types that can be handled include molecular sequences, gene frequencies, restriction sites and fragments, distance matrices, and discrete characters. Phylip works well with protein and nucleotide sequences Many other programs mimic the style of PHYLIP programs. (e.g. TREEPUZZLE, phyml, protml) Many other packages use PHYIP programs in their inner workings (e.g., PHYLO_WIN) PHYLIP runs under all operating systems Web interfaces are available
Programs in PHYLIP are Modular For example: SEQBOOT take one set of aligned sequences and writes out a file containing bootstrap samples. PROTDIST takes a aligned sequences (one or many sets) and calculates distance matices (one or many) FITCH (or NEIGHBOR) calculate best fitting or neighbor joining trees from one or many distance matrices CONSENSE takes many trees and returns a consensus tree …. modules are available to draw trees as well, but often people use treeview or njplot
is an excellent source of information. The Phylip Manual Brief one line descriptions of the programs are here The easiest way to run PHYLIP programs is via a command line menu (similar to clustalw). The program is invoked through clicking on an icon, or by typing the program name at the command line. > seqboot > protpars > fitch If there is no file called infile the program responds with: [gogarten@carrot gogarten]$ seqboot seqboot: can't find input file "infile" Please enter a new file name>
menu interface example: seqboot and protpars on infile1
Sequence alignment: CLUSTALW MUSCLE Removing ambiguous positions: T-COFFEE FORBACK Generation of pseudosamples: SEQBOOT PROTDIST TREE-PUZZLE Calculating and evaluating phylogenies: PROTPARS PHYML NEIGHBOR FITCH SH-TEST in TREE-PUZZLE CONSENSE Comparing phylogenies: Comparing models: Maximum Likelihood Ratio Test Visualizing trees: ATV, njplot, or treeview Phylip programs can be combined in many different ways with one another and with programs that use the same file formats.
Example 1 Protpars example: seqboot, protpars, consense NOTE the bootstrap majority consensus tree does not necessarily have the same topology as the “best tree” from the original data! threshold parsimony, gap symbols - versus ? (in vi you could use :%s/-/?/g to replace all – ?) outfile outtree compare to distance matrix analysis
branches are scaled with respect to bootstrap support values, the number for the deepest branch is handeled incorrectly by njplot and treeview protpars (versus distance/FM) Extended majority rule consensus treeCONSENSUS TREE:the numbers on the branches indicate the numberof times the partition of the species into the two setswhich are separated by that branch occurredamong the trees, out of 100.00 trees +------Prochloroc +----------------------100.-| | +------Synechococ | | +--------------------Guillardia +-85.7-| | | | +-88.3-| +------Clostridiu | | | | +-100.-| | | | +-100.-| +------Thermoanae | +-50.8-| | | | +-------------Homo sapie +------| | | | | +------Oryza sati | | +---------------100.0-| | | +------Arabidopsi | | | | +--------------------Synechocys | | | | +---------------53.0-| +------Nostoc pun | | +-99.5-| | +-38.5-| +------Nostoc sp | | | +-------------Trichodesm | +------------------------------------------------Thermosyne remember: this is an unrooted tree!
what might be the explanation for the red algae not grouping with the plants? (protpars versus) distance/FM Tree is scaled with respect to the estimated number of substitutions.
protdist PROTdist Settings for this run: P Use JTT, PMB, PAM, Kimura, categories model? Jones-Taylor-Thornton matrix G Gamma distribution of rates among positions? No C One category of substitution rates? Yes W Use weights for positions? No M Analyze multiple data sets? No I Input sequences interleaved? Yes 0 Terminal type (IBM PC, ANSI)? ANSI 1 Print out the data at start of run No 2 Print indications of progress of run Yes
subtree with branch lengths without and with correction for ASRV
phyml PHYML - A simple, fast, and accurate algorithm to estimate large phylogenies by maximum likelihood An online interface is here ; there is a command line version that is described here (not as straight forward as in clustalw); a phylip like interface is automatically invoked, if you type “phyml” – the manual is here. Phyml is installed on bbcxsrv1. Do example on atp_all.phy Note data type, bootstrap option within program, models for ASRV (pinvar and gamma), by default the starting tree is calculated via neighbor joining.
phyml - comments Under some circumstances the consensus tree calculated by phyml is wrong. It is recommended to save all the individual trees and to also evaluate them with consense from the phylip package. Note: phyml allows longer names, but consense allows only 10 characters! phyml is fast enough to analyze dataset with hundreds of sequences (in 1990, a maximum likelihood analyses with 12 sequences (no ASRV) took several days). For moderately sized datasets you can estimate branch support through a bootstrap analysis (it still might run several hours, but compared to protml or PAUP, this is extremely fast). The paper describing phyml is here, a brief interview with the authors is here
Trees – what might they mean? Calculating a tree is comparatively easy, figuring out what it might mean is much more difficult. If this is the probable organismal tree: species A species B species C species D what could be the reason for obtaining this gene tree: seq. from A seq. from D seq. from C seq. from B
e.g., 60% bootstrap support for bipartition (AD)(CB) lack of resolution seq. from A seq. from D seq. from C seq. from B
the two longest branches join together e.g., 100% bootstrap support for bipartition (AD)(CB) long branch attraction artifact seq. from A seq. from D seq. from C seq. from B What could you do to investigate if this is a possible explanation? use only slow positions, use an algorithm that corrects for ASRV
Gene Transfer molecular tree: seq. from A seq. from D seq. from C seq. from B speciation genetransfer Gene transfer Organismal tree: species A species B species C species D
molecular tree: molecular tree: seq. from A seq. from A seq. from A seq. from B seq. from B seq. from C seq. from C seq. from D seq. from D seq. from D seq.’ from B seq.’ from B seq.’ from C seq.’ from C seq.’ from C gene duplication gene duplication gene duplication seq.’ from D seq.’ from D seq.’ from D Organismal tree: Gene duplication species A species B species C gene duplication species D molecular tree:
Gene duplication and gene transfer are equivalent explanations. The more relatives of C are found that do not have the blue type of gene, the less likely is the duplication loss scenario Ancient duplication followed by gene loss Horizontal or lateral Gene Note that scenario B involves many more individual events than A 1 HGT with orthologous replacement 1 gene duplication followed by 4 independent gene loss events
What is it good for? Gene duplication events can provide an outgroup that allows rooting a molecular phylogeny. Most famously this principle was applied in case of the tree of life – the only outgroup available in this case are ancient paralogs (see http://gogarten.uconn.edu/cvs/Publ_Pres.htm for more info). However, the same principle also is applicable to any group of organisms, where a duplication preceded the radiation (example). Lineage specific duplications also provide insights into which traits were important during evolution of a lineage.
Function, ortho- and paralogy molecular tree: seq. from A seq.’ from B seq.’fromC seq.’ from D gene duplication seq. from B seq. from C seq. from D The presence of the duplication is a taxonomic character (shared derived character in species B C D). The phylogeny suggests that seq’ and seq have similar function, and that this function was important in the evolution of the clade BCD. seq’ in B and seq’in C and D are orthologs and probably have the same function, whereas seq and seq’ in BCD probably have different function (the difference might be in subfunctionalization of functions that seq had in A. – e.g. organ specific expression)