Download
1 / 53
530 likes | 732 Views
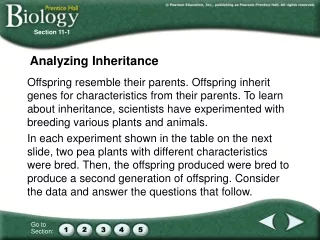
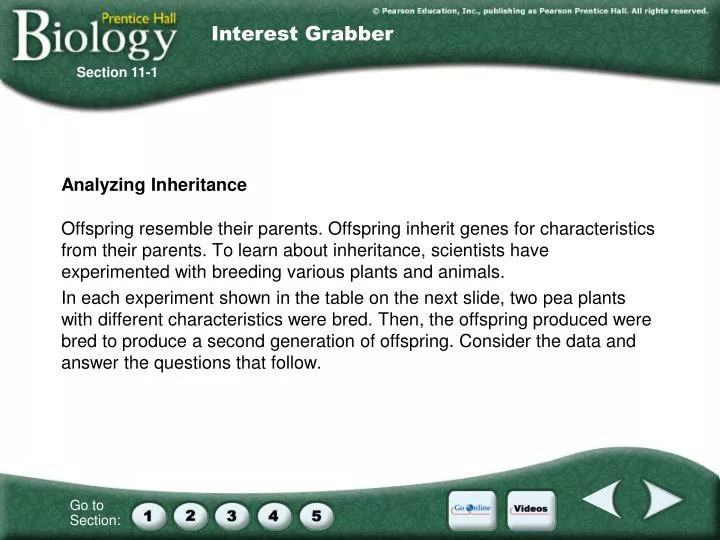
Interest Grabber. Section 11-1. Analyzing Inheritance. Offspring resemble their parents. Offspring inherit genes for characteristics from their parents. To learn about inheritance, scientists have experimented with breeding various plants and animals.

E N D
Interest Grabber Section 11-1 Analyzing Inheritance • Offspring resemble their parents. Offspring inherit genes for characteristics from their parents. To learn about inheritance, scientists have experimented with breeding various plants and animals. • In each experiment shown in the table on the next slide, two pea plants with different characteristics were bred. Then, the offspring produced were bred to produce a second generation of offspring. Consider the data and answer the questions that follow.
Parents Long stems short stems Red flowers white flowers Green pods yellow pods Round seeds wrinkled seeds Yellow seeds green seeds First Generation All long All red All green All round All yellow Second Generation 787 long: 277 short 705 red: 224 white 428 green: 152 yellow 5474 round: 1850 wrinkled 6022 yellow: 2001 green Interest Grabber continued Section 11-1 • 1. In the first generation of each experiment, how do the characteristics of the offspring compare to the parents’ characteristics? • 2. How do the characteristics of the second generation compare to the characteristics of the first generation?
Section Outline Section 11-1 • 11–1 The Work of Gregor Mendel A. Gregor Mendel’s Peas B. Genes and Dominance C. Segregation 1. The F1 Cross 2. Explaining the F1 Cross
Principles of Dominance Section 11-1 P Generation F1 Generation F2 Generation Tall Short Tall Tall Tall Tall Tall Short
Principles of Dominance Section 11-1 P Generation F1 Generation F2 Generation Tall Short Tall Tall Tall Tall Tall Short
Principles of Dominance Section 11-1 P Generation F1 Generation F2 Generation Tall Short Tall Tall Tall Tall Tall Short
Figure 11-3 Mendel’s Seven F1 Crosses on Pea Plants Section 11-1 Seed Shape Seed Color Seed Coat Color Pod Shape Pod Color Flower Position Plant Height Round Yellow Gray Smooth Green Axial Tall Wrinkled Green White Constricted Yellow Terminal Short Round Yellow Gray Smooth Green Axial Tall
Interest Grabber Section 11-2 Tossing Coins • If you toss a coin, what is the probability of getting heads? Tails? If you toss a coin 10 times, how many heads and how many tails would you expect to get? Working with a partner, have one person toss a coin • ten times while the other person tallies the results on a sheet of paper. Then, switch tasks to produce a separate tally of the second set of 10 tosses.
Interest Grabber continued Section 11-2 1. Assuming that you expect 5 heads and 5 tails in 10 tosses, how do the results of your tosses compare? How about the results of your partner’s tosses? How close was each set of results to what was expected? 2. Add your results to those of your partner to produce a total of 20 tosses. Assuming that you expect 10 heads and 10 tails in 20 tosses, how close are these results to what was expected? 3. If you compiled the results for the whole class, what results would you expect? 4. How do the expected results differ from the observed results?
Section Outline Section 11-2 • 11–2 Probability and Punnett Squares A. Genetics and Probability B. Punnett Squares C. Probability and Segregation D. Probabilities Predict Averages
Tt X Tt Cross Section 11-2
Tt X Tt Cross Section 11-2
Interest Grabber Section 11-3 Height in Humans • Height in pea plants is controlled by one of two alleles; the allele for a tall plant is the dominant allele, while the allele for a short plant is the ecessive one. What about people? Are the factors that determine height more complicated in humans?
Interest Grabber continued Section 11-3 • 1. Make a list of 10 adults whom you know. Next to the name of each adult, write his or her approximate height in feet and inches. • 2. What can you observe about the heights of the ten people? • 3. Do you think height in humans is controlled by 2 alleles, as it is in pea plants? Explain your answer.
Section Outline Section 11-3 • 11–3 Exploring Mendelian Genetics A. Independent Assortment 1. The Two-Factor Cross: F1 2. The Two-Factor Cross: F2 B. A Summary of Mendel’s Principles C. Beyond Dominant and Recessive Alleles 1. Incomplete Dominance 2. Codominance 3. Multiple Alleles 4. Polygenic Traits D. Applying Mendel’s Principles E. Genetics and the Environment
Alleles are separated during gamete formation “Factors” determine traits Some alleles are dominant, and some alleles are recessive Pea plants Law of Dominance Law of Segregation Concept Map Section 11-3 Gregor Mendel concluded that experimented with which is called the which is called the
Figure 11-10 Independent Assortment in Peas Section 11-3
Figure 11-11 Incomplete Dominance in Four O’Clock Flowers Section 11-3
Figure 11-11 Incomplete Dominance in Four O’Clock Flowers Section 11-3
Interest Grabber Section 11-4 How Many Chromosomes? • Normal human body cells each contain 46 chromosomes. The cell division process that body cells undergo is called mitosis and produces daughter cells that are virtually identical to the parent cell. Working with a partner, discuss and answer the questions that follow.
Interest Grabber continued Section 11-4 • 1. How many chromosomes would a sperm or an egg contain if either one resulted from the process of mitosis? • 2. If a sperm containing 46 chromosomes fused with an egg containing 46 chromosomes, how many chromosomes would the resulting fertilized egg contain? Do you think this would create any problems in the developing embryo? • 3. In order to produce a fertilized egg with the appropriate number of chromosomes (46), how many chromosomes should each sperm and egg have?
Section Outline Section 11-4 • 11–4 Meiosis A. Chromosome Number B. Phases of Meiosis 1. Meiosis I 2. Meiosis II C. Gamete Formation D. Comparing Mitosis and Meiosis
Crossing-Over Section 11-4
Crossing-Over Section 11-4
Crossing-Over Section 11-4
Figure 11-15 Meiosis Section 11-4 Meiosis I
Figure 11-15 Meiosis Section 11-4 Meiosis I Meiosis I
Figure 11-15 Meiosis Section 11-4 Meiosis I Meiosis I
Figure 11-15 Meiosis Section 11-4 Meiosis I
Figure 11-15 Meiosis Section 11-4 Meiosis I
Figure 11-17 Meiosis II Section 11-4 Meiosis II Prophase II Metaphase II Anaphase II Telophase II Meiosis I results in two haploid (N) daughter cells, each with half the number of chromosomes as the original. The chromosomes line up in a similar way to the metaphase stage of mitosis. The sister chromatids separate and move toward opposite ends of the cell. Meiosis II results in four haploid (N) daughter cells.
Figure 11-17 Meiosis II Section 11-4 Meiosis II Prophase II Metaphase II Anaphase II Telophase II Meiosis I results in two haploid (N) daughter cells, each with half the number of chromosomes as the original. The chromosomes line up in a similar way to the metaphase stage of mitosis. The sister chromatids separate and move toward opposite ends of the cell. Meiosis II results in four haploid (N) daughter cells.
Figure 11-17 Meiosis II Section 11-4 Meiosis II Prophase II Metaphase II Anaphase II Telophase II Meiosis I results in two haploid (N) daughter cells, each with half the number of chromosomes as the original. The chromosomes line up in a similar way to the metaphase stage of mitosis. The sister chromatids separate and move toward opposite ends of the cell. Meiosis II results in four haploid (N) daughter cells.
Figure 11-17 Meiosis II Section 11-4 Meiosis II Prophase II Metaphase II Anaphase II Telophase II Meiosis I results in two haploid (N) daughter cells, each with half the number of chromosomes as the original. The chromosomes line up in a similar way to the metaphase stage of mitosis. The sister chromatids separate and move toward opposite ends of the cell. Meiosis II results in four haploid (N) daughter cells.
Figure 11-17 Meiosis II Section 11-4 Meiosis II Prophase II Metaphase II Anaphase II Telophase II Meiosis I results in two haploid (N) daughter cells, each with half the number of chromosomes as the original. The chromosomes line up in a similar way to the metaphase stage of mitosis. The sister chromatids separate and move toward opposite ends of the cell. Meiosis II results in four haploid (N) daughter cells.
Interest Grabber Section 11-5 Forever Linked? • Some genes appear to be inherited together, or “linked.” If two genes • are found on the same chromosome, does it mean they are linked forever? • Study the diagram, which shows four genes labeled A–E and a–e, and then answer the questions on the next slide.
Interest Grabber continued Section 11-5 • In how many places can crossing over result in • genes A and b being on the same chromosome? • 2. In how many places can crossing over result in genes A and c being on the same chromosome? Genes A and e? • 3. How does the distance between two genes on a chromosome affect the chances that crossing over will recombine those genes?
Section Outline Section 11-5 • 11–5 Linkage and Gene Maps A. Gene Linkage B. Gene Maps
Comparative Scale of a Gene Map Section 11-5 Mapping of Earth’s Features Mapping of Cells, Chromosomes, and Genes Cell Earth Chromosome Country Chromosome fragment State Gene City People Nucleotide base pairs
Figure 11-19 Gene Map of the Fruit Fly Section 11-5 Exact location on chromosomes Chromosome 2
Videos Video Contents • Click a hyperlink to choose a video. • Meiosis Overview • Animal Cell Meiosis, Part 1 • Animal Cell Meiosis, Part 2 • Segregation of Chromosomes • Crossing Over
Video 1 Video 1 Meiosis Overview • Click the image to play the video segment.
Video 2 Video 2 Animal Cell Meiosis, Part 1 • Click the image to play the video segment.
Video 3 Video 3 Animal Cell Meiosis, Part 2 • Click the image to play the video segment.
Video 4 Video 4 Segregation of Chromosomes • Click the image to play the video segment.
Video 5 Video 5 Crossing Over • Click the image to play the video segment.
Go Online Internet • The latest discoveries in genetics • Interactive test • Articles on genetics • For links on Punnett squares, go to www.SciLinks.org and enter the Web Code as follows: cbn-4112. • For links on Mendelian genetics, go to www.SciLinks.org and enter the Web Code as follows: cbn-4113. • For links on meiosis, go to www.SciLinks.org and enter the Web Code as follows: cbn-4114.
Interest Grabber Answers Section 1 Answers • 1. In the first generation of each experiment, how do the characteristics of the offspring compare to the parents’ characteristics? • All offspring had the same characteristic, which was like one of the parents’. The other characteristic seemed to have disappeared. • 2. How do the characteristics of the second generation compare to the characteristics of the first generation? • Both characteristics appeared in this generation. The characteristic that had “disappeared” in the first generation did not appear as often as the other characteristic. (It appears about 25 percent of the time.)
Interest Grabber Answers 1. Assuming that you expect 5 heads and 5 tails in 10 tosses, how do the results of your tosses compare? How about the results of your partner’s tosses? How close was each set of results to what was expected? Results will vary, but should be close to 5 heads and 5 tails. 2. Add your results to those of your partner to produce a total of 20 tosses. Assuming that you expect 10 heads and 10 tails in 20 tosses, how close are these results to what was expected? The results for 20 tosses may be closer to the predicted 10 heads and 10 tails. 3. If you compiled the results for the whole class, what results would you expect? The results for the entire class should be even closer to the number predicted by the rules of probability. 4. How do the expected results differ from the observed results? The observed results are usually slightly different from the expected results. Section 2 Answers
Interest Grabber Answers Section 3 Answers • 1. Make a list of 10 adults whom you know. Next to the name of each adult, write his or her approximate height in feet and inches. • Check students’ answers to make sure they are realistic. • 2. What can you observe about the heights of the ten people? • Students should notice that there is a range of heights in humans. • 3. Do you think height in humans is controlled by 2 alleles, as it is in pea plants? Explain your answer. • No, height does not seem to be controlled by two alleles, as it is in pea plants. Height in humans can vary greatly and is not just found in tall and short phenotypes.