Download
1 / 11
110 likes | 196 Views
Summary of U.S. International Transactions. (For the Year of 2000 in Millions of Dollars). Current Account. Exports of goods and services and income receipts 1,418,568 Goods, balance of payments basis 772,210 Services 293,492 Income receipts 352,866

E N D
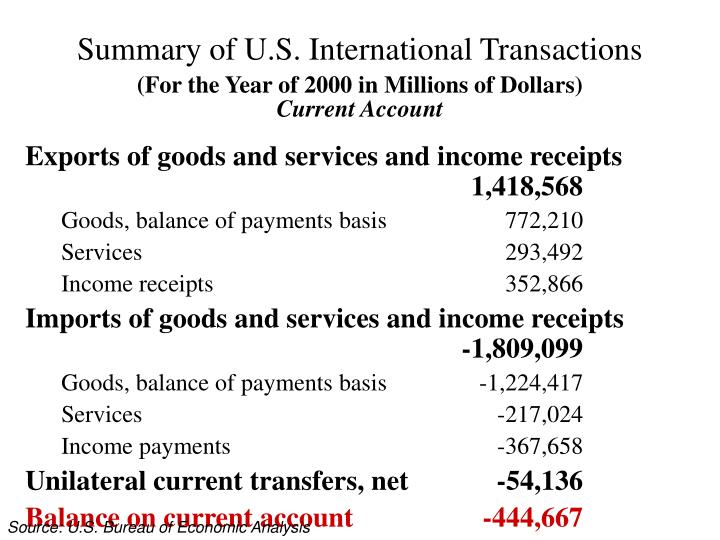
Summary of U.S. International Transactions (For the Year of 2000 in Millions of Dollars) Current Account Exports of goods and services and income receipts 1,418,568 Goods, balance of payments basis 772,210 Services 293,492 Income receipts 352,866 Imports of goods and services and income receipts -1,809,099 Goods, balance of payments basis -1,224,417 Services -217,024 Income payments -367,658 Unilateral current transfers, net -54,136 Balance on current account -444,667 Source: U.S. Bureau of Economic Analysis
Summary of U.S. International Transactions (For the Year of 2000 in millions of Dollars) Capital Account (newly defined) Includes unilateral current transfers that are really shifts in assets, not current income. E.g. debt forgiveness, transfers by immigrants, the sale or purchase of rights to natural resources or patents. Capital account transactions, net 705 Source: U.S. Bureau of Economic Analysis
Summary of U.S. International Transactions (For the Year of 2000 in Millions of Dollars) Financial Account U.S.-owned assets abroad, net (increase/financial outflow) -580,952 U.S. official reserve assets, net -290 Other U.S. Gov’t assets, net -944 U.S. private assets, net -579,718 Foreign-owned assets in the U.S., net (increase/financial inflow)1,024,218 Foreign official assets in the U.S., net 37,619 Other foreign assets in the U.S., net 986,599 Net financial flows 443,266 Statistical discrepancy (sum of items in all accounts with sign reversed)696 Source: U.S. Bureau of Economic Analysis
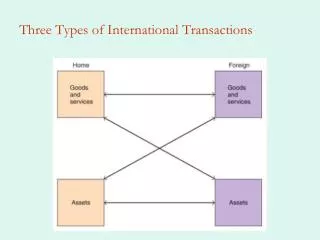
Canada (179,231) Mexico (111,136) Bahamas (1,0) Guatemala (2,3) Honduras (3,3) Jamaica (1,1) El Salvador (2,2) Dominican Republic (4,4) Costa Rica (2,4) Trinidad and Tobago (1,2) Panama (2,0) Colombia (4,7) Peru (2,2) Venezuela (6,19) Ecuador (1,2) Brazil (15,14) Chile (3,3) Argentina (5,3) Distribution of U.S. Exports and Imports For the Year of 2000 (exports, imports) in Billions of $ Source: U.S. Census Bureau
Sweden (5,10) Poland (1,1) Finland (2,3) Norway (2,6) Denmark (2,3) Russia (2,8) Germany (29,59) Czech Republic (1,1) Netherlands (22,10) Austria (3,3) Ireland (8,16) Hungary (1,3) United Kingdom (42,43) Italy (11,25) Belgium (14,10) Portugal (1,2) Turkey (4,3) Spain (6,6) France (20,30) Greece (1,1) Switzerland (10,10) Distribution of U.S. Exports and Imports (exports, imports) in Billions of $ for the Year of 2000 Source: U.S. Census Bureau
Algeria (1,3) Egypt (3,1) Nigeria (1,11) Gabon (0,2) Angola (0,4) South Africa (3,4) Distribution of U.S. Exports and Imports For the Year of 2000 (exports, imports) in Billions of $ Source: U.S. Census Bureau
Iraq (0,6) Bangladesh (0,2) Japan (65,146) Israel (8,13) Pakistan (0,2) Kuwait (1,3) South Korea (28,40) China (16,100) Saudi Arabia (6,14) Taiwan (24,41) Hong Kong (15,11) India (4,11) United Arab Emirates (2,1) Sri Lanka (0,2) Macao (0,1) Philippines (9,14) Thailand (7,16) Indonesia (2,10) Malaysia (11,26) Australia (12,6) Singapore (18,19) New Zealand (2,2) Distribution of U.S. Exports and Imports For the Year of 2000 (exports, imports) in Billions of $ Source: U.S. Census Bureau
Exports Imports Australasia 14.8 1.9% Other Asia 23.6 3.0% South East Asia Other Asia 56.5 4.6% Australasia 8.8 0.7% 47.4 6.1% 88.0 7.2% Canada 229.2 18.8% Canada 178.8 22.8% 148.5 19.0% East Asia 340.3 28.0% Mexico 135.9 11.2% Mexico 111.7 14.3% 11.0 1.4% Africa 27.6 2.3% Other America 73.3 6.0% Other America 59.3 7.6% Eastern Europe 6.1 0.8% 181.3 23.2% Western Europe 241.0 19.8% Eastern Europe 16.2 1.3% Distribution of U.S. Exports and Imports For the Year of 2000 in Billions of $ Source: U.S. Office of Trade and Economic Analysis
U.S. Imports Billions of US$ U.S. Exports U.S. Balance of Trade U.S. Balance of Trade Trend Source: U.S. Census Bureau
DFI by U.S. Firms Billions of US$ DFI in the U.S. Direct Foreign Investment Positions of the United States on a Historical Cost basis Source: U.S. Bureau of Economic Analysis
DFI by U.S. Firms DFI in the U.S. Other Asia & Pacific 11.6% Other Asia & Pacific 2.5% Other Western Hemisphere 19.2% 3.4% Japan 4.5% Canada 10.2% Canada 8.1% Japan 13.2% Middle East 1.0% France 9.6% Middle East 0.7% Africa 1.3% Germany 9.9% Other Europe 16.6% Other Europe 21.5% France 3.1% Germany 4.3% United Kingdom 18.8% United Kingdom 18.5% Netherlands 9.3% 12.3% Distribution of DFI for the U.S. For the Year of 2000 Source: U.S. Bureau of Economic Analysis