Download
1 / 11
110 likes | 391 Views
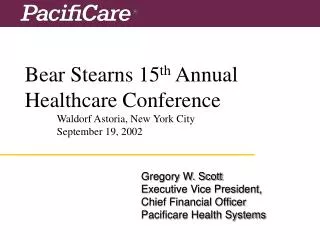
Bear Stearns Transportation Conference May 8, 2007 New York, New York James A. Squires Executive Vice President Finance Railway Operating Revenue First Quarter 2007 vs. 2006 Total - $2.247 Billion Down $56 Million, 2% vs. 1Q 2006 19 consecutive quarters of growth 2Q 2002 – 4Q 2006

E N D
Bear Stearns Transportation ConferenceMay 8, 2007New York, New York James A. Squires Executive Vice President Finance
Railway Operating RevenueFirst Quarter 2007 vs. 2006 Total- $2.247 Billion Down $56 Million, 2% vs. 1Q 2006 • 19 consecutive quarters of growth 2Q 2002 – 4Q 2006 • Declines driven by volume and mix • 4% net pricing gain Coal $557 (0%) Merchandise $1,228 Intermodal $462 (4%) (1%) Rev. $Millions
Income From Railway OperationsFirst Quarter 2007 vs. 2006($ Millions) Favorable (Unfavorable) First Qtr 2007 First Qtr 2006 $ % Railway Operating Revenues $ 2,247 $ 2,303 $ (56)(2%) Railway Operating Expenses 1,719 1,752 33 2 Income From Railway Operations $ 528 $ 551 $ (23)(4%) Railway Operating Ratio 76.5 76.1 (0.4)(1%)
Net Income and Diluted Earnings per ShareFirst Quarter($ Millions except per share) Net Income Diluted Earnings per Share $ 305 $ 285 $ 0.72 $ 0.71 2006 2007 2006 2007 % Change vs. Prior Period - 7% - 1%
Freight Transportation Environment Highway Congestion/Port Congestion Driver Shortages in Trucking Historically High Fuel Costs
Capital Expenditures($ Millions) $ 1,340 $ 1,178 $ 1,041 $ 1,025 $ 720 2003 2004 2005 2006 2007 Budget
UP and NS to offer fastest service between Southern California and Southeast UP-NS eastbound domestic transcontinental service will move over Shreveport starting May 21 New route combines UP Sunset Route and KCS-NS route between Shreveport and Meridian Norfolk Southern & Union Pacific Expand Intermodal Service
Share Repurchase Program • Share repurchase program originally authorized in November 2005 • Program amended to increase number of shares from 50 to 75 million and shorten term by five years • 27.4 million shares repurchased for $1.2 billion,including 5.6 million shares in first quarter 2007