Download
1 / 18
180 likes | 610 Views
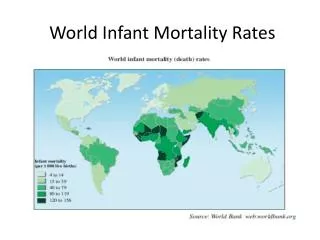
An Analysis of Pediatric Mortality Rates in Navajo County, Arizona. Wade Kartchner, MD, MPH Director, Navajo County Public Health Services District. Navajo County Demographics. County population-111,399 (2006 est.)

E N D
An Analysis of Pediatric Mortality Rates in Navajo County, Arizona Wade Kartchner, MD, MPH Director, Navajo County Public Health Services District
Navajo County Demographics County population-111,399 (2006 est.) Contains a large portion of the Navajo Nation, as well as a large majority of the Hopi tribe and the White Mountain Apache tribe Native Americans represent 46.4% of the county population
Arizona Child Fatality Review Program • Impetus for this study • Founded in 1993 • Consists of locally developed teams in counties throughout the state. • Goal is to reduce preventable child fatalities as it: • Reviews each child fatality and recommends legislation and public policy changes
Navajo County Study • Data derived from Navajo County’s local Child Fatality Review Team • Observational, population-based • Deaths reviewed from January 1998 to December 2006 • Pediatric mortality rates for Navajo, Hopi, White Mountain tribes, and non-tribal areas calculated using the estimated 2002 population (the midpoint of the study) and compared with each other and the overall county rate
Navajo County Study • Used the National Vital Statistics method of determining confidence intervals for mortality rates when the number of deaths is not large (fewer than 100) • When the resultant 95% confidence intervals do not overlap, then the difference is considered to be statistically significant at the 0.05 level.* • *National Vital Statistics Reports, Vol. 55 Number 19, August 21, 2007, p.116, 117.
Navajo County pediatric deaths by residence and gender, 1998-2006
Mean pediatric mortality rates in Navajo County, Arizona by tribe/non-tribal areas, 1998-2006 *p < 0.05 compared to all other subgroups, except the Hopi Tribe
Mean pediatric mortality rates in Navajo County, Arizona by tribe/non-tribal areas and gender, 1998-2006 *p< 0.05, compared to all other male subgroups. ** p< 0.05 compared to all other female subgroups except for the Hopi Tribe.
Health Disparities • Health disparities between Native Americans and non-Native Americans exist • Reasons may be multifactorial*: -Racial discrimination -Limited access to health services -Poor access to health insurance -Insufficient federal funding -Quality of care -Availability of culturally competent care -Poverty and lack of education -Behavior or lifestyle choices *“Broken Promises: Evaluating the Native American Health Care System”, September 2004 report by the United States Commission on Civil Rights at http://www.usccr.gov/pubs/nahealth/nabroken.pdf.
Navajo County disparities • The three tribes live in relative close proximity to each other • Share many of the same problems and similar health care systems and delivery • Pediatric mortality rates in one tribe significantly different than the others • Why?
Further investigations • Age stratification (problems with low numbers) • Preventable vs. non-preventable (Arizona CFRP has this data available) • Are there differences between the groups regarding preventability? • Might point to group differences that relate to specific behavioral or societal causes existing within the various tribes that lead to this disparity