Download
1 / 1
10 likes | 85 Views
Linear Probability Plot and. Least-Squares Best-Fit Line. 99%. 98%. 95%. 90%. 84%. 75%. 50%. 25%. 16%. 10%. 5%. 2%. 1%. -20. -15. -10. -5. 0. 5. 10. 15. 20. 25. Concentration. 1% OEL. Sequential Data Plot.

E N D
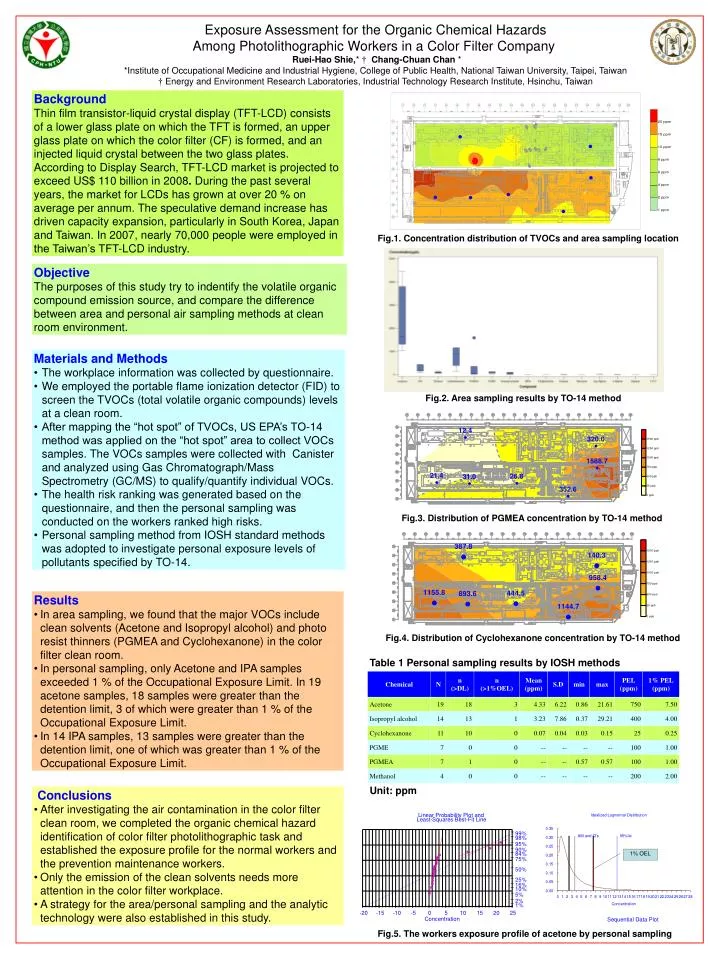
Linear Probability Plot and Least-Squares Best-Fit Line 99% 98% 95% 90% 84% 75% 50% 25% 16% 10% 5% 2% 1% -20 -15 -10 -5 0 5 10 15 20 25 Concentration 1% OEL Sequential Data Plot Exposure Assessment for the Organic Chemical Hazards Among Photolithographic Workers in a Color Filter CompanyRuei-Hao Shie,*†Chang-Chuan Chan * *Institute of Occupational Medicine and Industrial Hygiene, College of Public Health, National Taiwan University, Taipei, Taiwan†Energy and Environment Research Laboratories, Industrial Technology Research Institute, Hsinchu, Taiwan Background Thin film transistor-liquid crystal display (TFT-LCD) consists of a lower glass plate on which the TFT is formed, an upper glass plate on which the color filter (CF) is formed, and an injected liquid crystal between the two glass plates. According to Display Search, TFT-LCD market is projected to exceed US$ 110 billion in 2008. During the past several years, the market for LCDs has grown at over 20 % on average per annum. The speculative demand increase has driven capacity expansion, particularly in South Korea, Japan and Taiwan. In 2007, nearly 70,000 people were employed in the Taiwan’s TFT-LCD industry. ● ● ● ● ● ● ● Fig.1. Concentration distribution of TVOCs and area sampling location Objective The purposes of this study try to indentify the volatile organic compound emission source, and compare the difference between area and personal air sampling methods at clean room environment. • Materials and Methods • The workplace information was collected by questionnaire. • We employed the portable flame ionization detector (FID) to screen the TVOCs (total volatile organic compounds) levels at a clean room. • After mapping the “hot spot” of TVOCs, US EPA’s TO-14 method was applied on the “hot spot” area to collect VOCs samples. The VOCs samples were collected with Canister and analyzed using Gas Chromatograph/Mass Spectrometry (GC/MS) to qualify/quantify individual VOCs. • The health risk ranking was generated based on the questionnaire, and then the personal sampling was conducted on the workers ranked high risks. • Personal sampling method from IOSH standard methods was adopted to investigate personal exposure levels of pollutants specified by TO-14. Fig.2. Area sampling results by TO-14 method Fig.3. Distribution of PGMEA concentration by TO-14 method • Results • In area sampling, we found that the major VOCs include clean solvents (Acetone and Isopropyl alcohol) and photo resist thinners (PGMEA and Cyclohexanone) in the color filter clean room. • In personal sampling, only Acetone and IPA samples exceeded 1 % of the Occupational Exposure Limit. In 19 acetone samples, 18 samples were greater than the detention limit, 3 of which were greater than 1 % of the Occupational Exposure Limit. • In 14 IPA samples, 13 samples were greater than the detention limit, one of which was greater than 1 % of the Occupational Exposure Limit. Fig.4. Distribution of Cyclohexanone concentration by TO-14 method Table 1 Personal sampling results by IOSH methods Unit: ppm • Conclusions • After investigating the air contamination in the color filter clean room, we completed the organic chemical hazard identification of color filter photolithographic task and established the exposure profile for the normal workers and the prevention maintenance workers. • Only the emission of the clean solvents needs more attention in the color filter workplace. • A strategy for the area/personal sampling and the analytic technology were also established in this study. Fig.5. The workers exposure profile of acetone by personal sampling