Download
1 / 18
180 likes | 386 Views
Warm Up Order the numbers from least to greatest. 1. 7, 4, 15, 9, 5, 2 2. 70, 21, 36, 54, 22 Divide. 2, 4, 5, 7, 9, 15. 21, 22, 36, 54, 70. 205. 3. 820 4. 65. 4. 650 10. 45. 5. 1125 25. 6. 2275 7. 325. Common Core State Standards Learning Objective. 7.SP.3

E N D
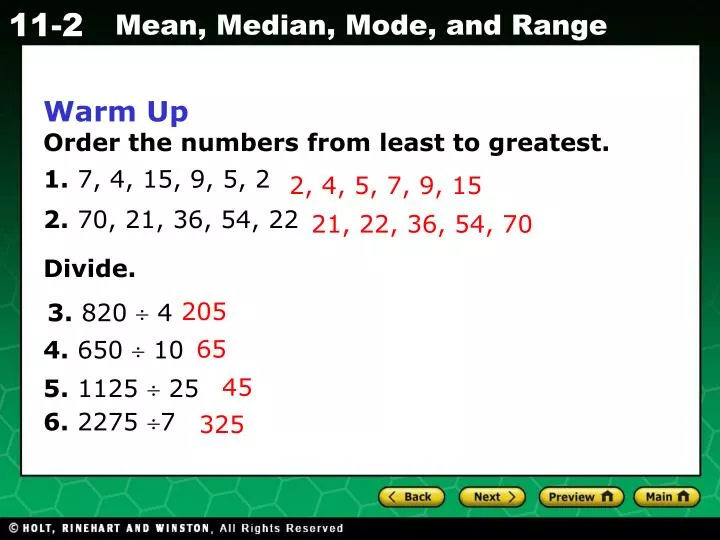
Warm Up Order the numbers from least to greatest. 1. 7, 4, 15, 9, 5, 2 2. 70, 21, 36, 54, 22 Divide. 2, 4, 5, 7, 9, 15 21, 22, 36, 54, 70 205 3. 820 4 65 4. 650 10 45 5. 1125 25 6. 2275 7 325
Common Core State Standards Learning Objective 7.SP.3 Compare two numerical data distributions.
Vocabulary mean median
Helpful Hint The mean is sometimes called the average. The mean is the sum of the data values divided by the number of data items. The median is the middle value of an odd number of data items arranged in order. For an even number of data items, the median is the average of the two middle values.
sum 8 items Additional Example 1: Finding the Mean & Median of the Data Find the meanand median of the data set. 4, 7, 8, 2, 1, 2, 4, 2 mean: Add the values. 4 + 7 + 8 + 2 + 1 + 2 + 4 + 2 = 30 Divide the sum by the number of items. 30 = 3.75 8 The mean is 3.75.
Additional Example 1 Continued Find the mean and median of the data set. 4, 7, 8, 2, 1, 2, 4, 2 median: Arrange the values in order. 1, 2, 2, 2, 4, 4, 7, 8 There are two middle values, so find the mean of these two values. 2 + 4 = 6 6 2 = 3 The median is 3.
sum 8 items Check It Out! Example 1 Find the meanand median of the data set. 6, 4, 3, 5, 2, 5, 1, 8 mean: Add the values. 6 + 4 + 3 + 5 + 2 + 5 + 1 + 8 = 34 Divide the sum = 34 8 4.25 by the number of items. The mean is 4.25.
Check It Out! Example 1 Continued Find the mean and median of the data set. 6, 4, 3, 5, 2, 5, 1, 8 median: Arrange the values in order. 1, 2, 3, 4, 5, 5, 6, 8 There are two middle values, so find the mean of these two values. 4 + 5 = 9 9 2 = 4.5 The median is 4.5.
The mean and median are measures of central tendency used to represent the “middle” of a data set. To decide which measure is most appropriate for describing a set of data, think about what each measure tells you about the data. The measure that you choose may depend on how the information in the data set is being used.
4 6 8 10 12 14 16 Additional Example 2: Choosing the Best Measure to Describe a Set of Data The line plot shows the number of miles each of the 17 members of the cross-country team ran in a week. Find the mean and median. Which measure best describes this data? Justify your answer. X X X XX XXXX XXX XX XX X Number of Miles
Additional Example 2 Continued The line plot shows the number of miles each of the 17 members of the cross-country team ran in a week. Find the mean and median. Which measure best describes this data? Justify your answer. mean: 4 + 4 + 4 + 4 + 4 + 5 + 5 + 5 + 6 + 6 + 14 + 15 + 15 + 15 + 15 + 16 + 16 17 153 17 = = 9 The mean is 9. The mean best describes the data set because the data is clustered fairly evenly about two areas.
Additional Example 2 Continued The line plot shows the number of miles each of the 17 members of the cross-country team ran in a week. Find the mean and median. Which measure best describes this data? Justify your answer. median: 4, 4, 4, 4, 4, 5, 5, 5, 6, 6, 14, 15, 15, 15, 15, 16, 16 The median is 6. The median does not best describe the data set because many values are not clustered around the data value 6.
10 20 30 40 50 60 70 Check It Out! Example 2 The line plot shows the number of dollars each of the 10 members of the cheerleading team raised in a week. Find the mean and median of the data. Which measure best describes this data? Justify your answer. XXXX XX XX X X Number Dollars
Check It Out! Example 2 Continued The line plot shows the number of dollars each of the 10 members of the cheerleading team raised in a week. Which measure of central tendency best describes this data? Justify your answer. mean: 15 + 15 + 15 + 15 + 20 + 20 + 40 + 60 + 60 + 70 10 330 10 = = 33 The mean is 33. Most of the cheerleaders raised less than $33, so the mean does not best describe the data set.
Check It Out! Example 2 Continued The line plot shows the number of dollars each of the 10 members of the cheerleading team raised in a week. Which measure of central tendency best describes this data? Justify your answer. median: 15, 15, 15, 15, 20, 20, 40, 60, 60, 70 The median is 20. The median best describes the data set because it is closest to the amount most cheerleaders raised.
Lesson Quiz: Part I 1. Find the mean and median of the data set. 8, 10, 46, 37, 20, 8, and 11 mean: 20; median: 11
Checking for Understanding Mean, Median and Mode
Classwork & Homework Lesson 11-2 Practice B Lesson 11-2 Problem Solving